Bullish Candlestick Patterns
Bullish patterns signal a build-up of buying pressure or exhaustion of a downtrend — common entry signals for long positions. Below are 18 patterns ranked by reliability, from the hammer to the morning star.
What is a bullish candlestick pattern?
A bullish candlestick pattern is a single- or multi-candle shape that signals a shift in market sentiment from selling pressure to buying pressure. The typical scenario: after a sustained downtrend, sellers run out of steam, buyers take back control, and the next candle confirms the reversal.
The value of a bullish pattern depends heavily on context. It is only reliable near a support level, in an oversold RSI region (typically below 30) or on above-average volume. On its own, a hammer in a sideways market is noise — the same hammer at the bottom of a long decline is a strong reversal signal.
Reliability is improved by: multi-candle patterns (three candles beat one), higher volume on the key candle, a confirming green candle in the next period, and a technical level nearby (support, Fibonacci, moving average).
18 bullish patterns
Sorted by reliability — strongest signals first
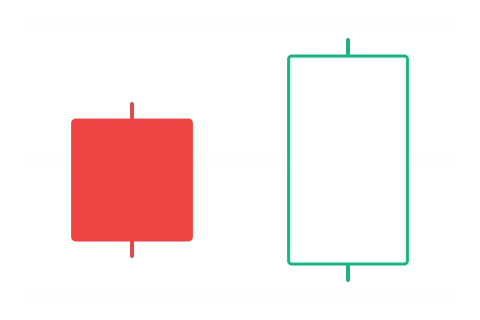
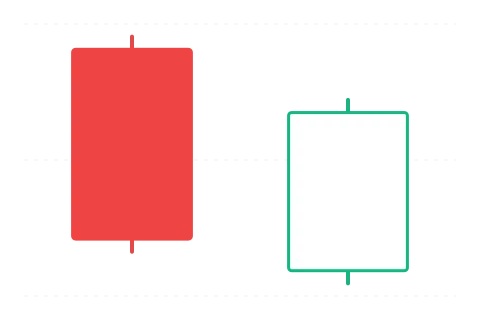
Bullish Engulfing
Bullish Engulfing
A two-candle bullish reversal pattern where a large green body fully engulfs the previous small red body.
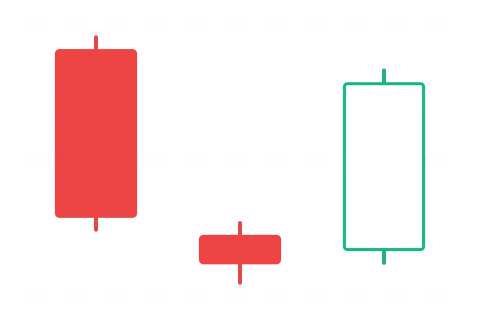
Morning Star
Morning Star
A three-candle bullish reversal pattern: large red candle, small indecision candle, then large green candle as sentiment shifts.
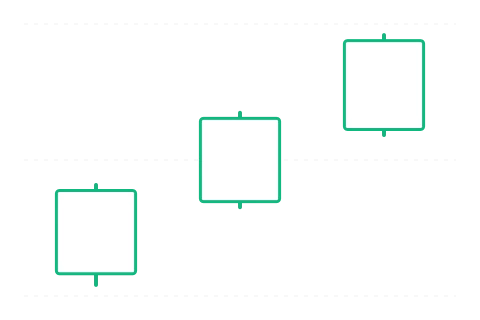
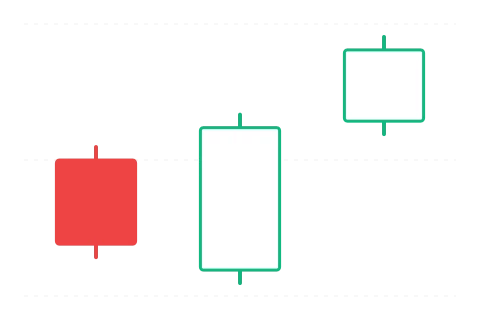
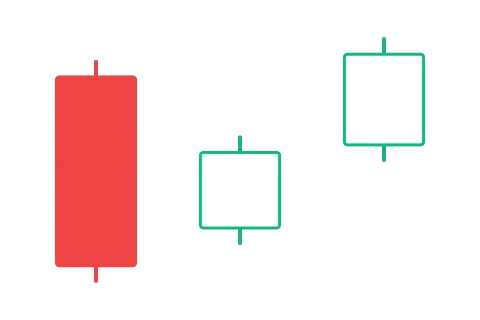
Three White Soldiers
Three White Soldiers
Three consecutive large green candles, each closing higher and leaving only a small upper wick.
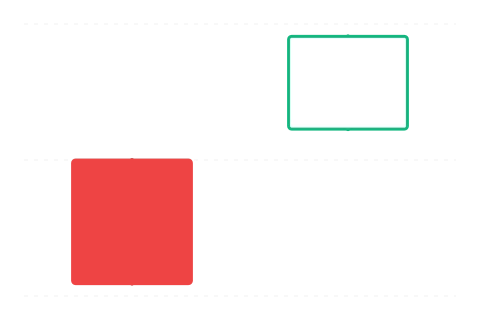
Bullish Kicking
Bullish Kicking
A bearish marubozu is followed by a bullish marubozu after an upside gap, marking a sharp sentiment shift from one session to the next.
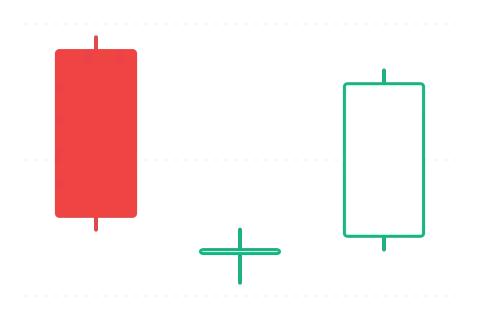
Morning Doji Star
Morning Doji Star
A stronger Morning Star variant: the middle candle is a full doji, making the market’s uncertainty more visible.
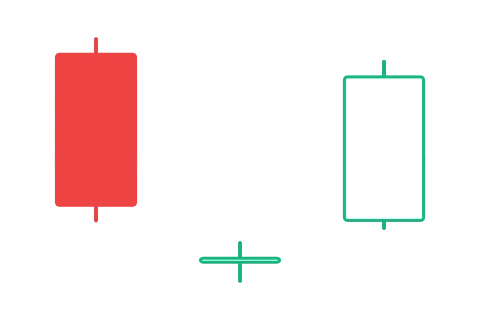
Bullish Abandoned Baby
Bullish Abandoned Baby
A three-candle bullish reversal pattern with a fully isolated doji between two gaps — extremely rare and often a strong signal.
Three Outside Up
Three Outside Up
A bullish engulfing pattern confirmed by a third bullish candle, forming a three-candle reversal signal.
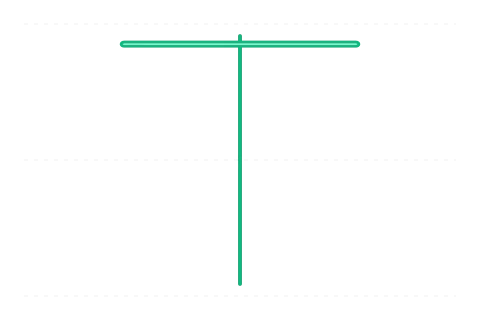
Hammer
Hammer
A one-candle bullish reversal pattern that appears after a downtrend, with a small body near the top and a long lower wick.

Bullish Marubozu
Bullish Marubozu
A large green candle with virtually no wicks, showing clean buyer dominance from the open through the close.
Piercing Line
Piercing Line
A bullish two-candle reversal pattern where a large green candle closes above the midpoint of the prior red candle.
Three Inside Up
Three Inside Up
A bullish harami confirmed by a third bullish candle, signaling a gradual reversal attempt after a downtrend.
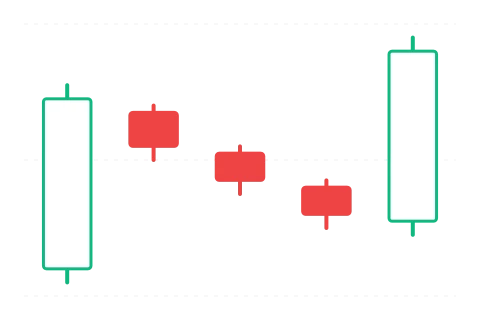
Rising Three Methods
Rising Three Methods
A bullish continuation pattern: one large green candle, three small red pullback candles inside its range, then another strong green candle.
Inverted Hammer
Inverted Hammer
A bullish reversal candlestick pattern with a small lower body and a long upper wick, appearing near the end of a downtrend.
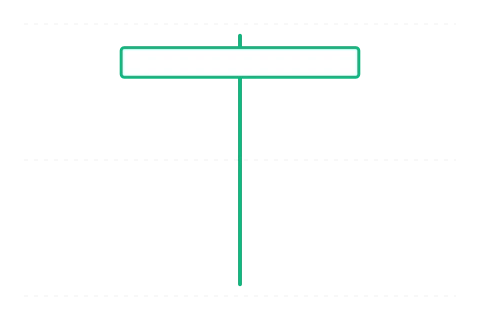
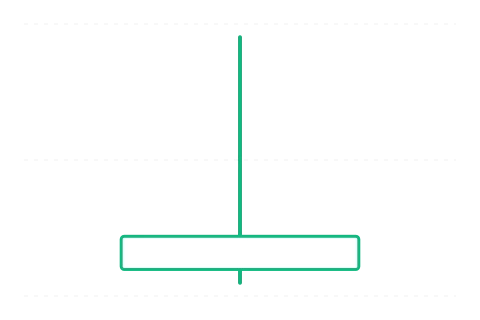
Dragonfly Doji
Dragonfly Doji
A doji with a long lower wick: sellers pushed price down, but buyers drove it back to the open by the close.
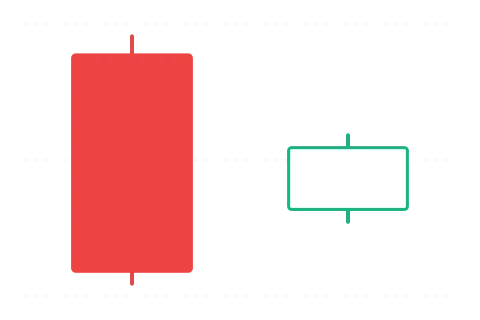
Bullish Harami
Bullish Harami
A large red candle is followed by a small green body that sits entirely inside the first candle’s body.
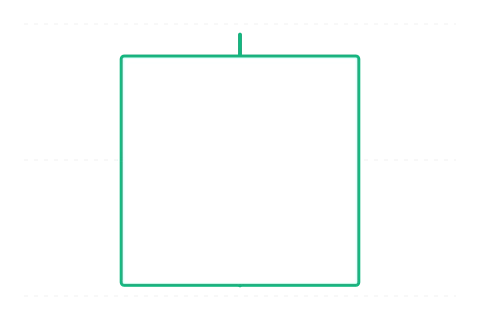
Bullish Belt Hold
Bullish Belt Hold
A large green candle with no lower wick: price opens at the period low and rises through the session.
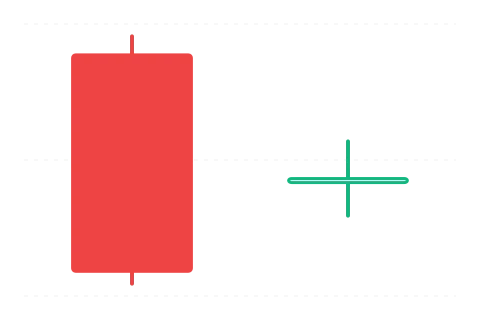
Bullish Harami Cross
Bullish Harami Cross
A large red candle followed by a doji contained within the first body, showing a sharp rise in indecision after a downtrend.
Tweezer Bottom
Tweezer Bottom
Two consecutive candles share the same low, showing two failed attempts to break lower and a possible bullish reversal.
When to trade bullish patterns
1. Trend context. Bullish reversal patterns are only meaningful at the end of a downtrend — not in sideways markets and not in an existing uptrend. A bullish engulfing at the bottom of a sharp decline is a strong signal; the same shape in the middle of a 2-week range is noise.
2. Confirmation candle. The most common mistake is entering immediately on the close of the pattern's last candle. Wait for the next period to confirm with a green candle — this filters out roughly a third of false signals.
3. Volume. Above-average volume (especially on the key candle, e.g. the third candle of a morning star) significantly improves the pattern's statistical reliability. A low-volume pattern is a weak signal.
4. Entry and stop loss. Enter on the open or close of the confirmation candle. Place the stop loss below the lowest point of the pattern (typically a few ATRs below the lower wick). Take profit at a minimum 1:2 risk/reward ratio — if the next resistance level is closer than twice the stop distance, skip the setup.
5. Combine with other tools. Do not trade candlestick patterns alone. Combine them with a trend indicator (MA, EMA), a momentum indicator (RSI, MACD), support/resistance levels and Fibonacci levels. A bullish engulfing at major support, with oversold RSI and positive MACD divergence — that is a setup.
Common mistakes
- Trading without trend contextA hammer in a sideways market or in an existing uptrend is not a reversal signal — it is just a random shape. Bullish reversals only show a positive statistical edge at the end of a downtrend.
- Skipping the confirmation candleThe close of the pattern's last candle is not a guarantee — wait for the next period's confirming green candle. This is the single biggest source of false signals.
- Stop loss inside the pattern's bodyThe stop loss belongs below the lowest point of the pattern (below the lower wick), not at the body's low. A tight stop is taken out by normal noise before the pattern can play out.
- Trading short time frames (1m, 5m)Bullish-pattern reliability collapses on short time frames — the noise-to-signal ratio is too poor. Daily (D1) and weekly (W1) work best; 4-hour (H4) is acceptable.
- Using a single indicatorA candlestick pattern alone is not an entry signal — combine it with a support level, RSI, moving average or volume. Multiple signals together produce statistically better setups.