Bearish Candlestick Patterns
Bearish patterns signal a build-up of selling pressure or exhaustion of an uptrend — a warning to close long positions or a short signal. Below are 19 patterns ranked by reliability, from the shooting star to the evening star.
What is a bearish candlestick pattern?
A bearish candlestick pattern is a single- or multi-candle shape that signals a shift in market sentiment from buying pressure to selling pressure. The typical scenario: after a sustained uptrend, buyers exhaust themselves, sellers take control, and the next candle confirms the reversal.
The value of a bearish pattern depends heavily on context. It is only reliable near a resistance level, in an overbought RSI region (typically above 70) or on above-average volume. On its own, a shooting star in a sideways market is noise — the same shooting star at the top of a long rally is a strong reversal signal.
Reliability is improved by: multi-candle patterns (three candles beat one), higher volume on the key candle, a confirming red candle in the next period, and a technical level nearby (resistance, Fibonacci, moving average).
19 bearish patterns
Sorted by reliability — strongest signals first
Bearish Engulfing
Bearish Engulfing
A two-candle bearish reversal pattern where a large red body fully engulfs the prior small green body after an uptrend.
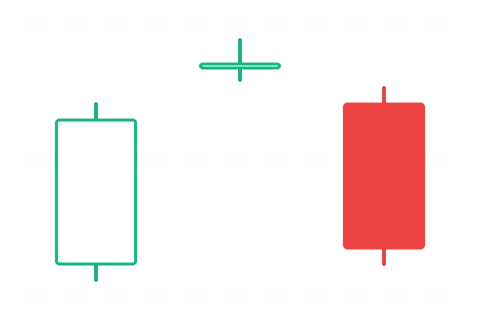
Evening Star
Evening Star
A three-candle bearish reversal pattern: large green candle, small indecision candle, then large red candle as sentiment deteriorates.
Three Black Crows
Three Black Crows
Three consecutive large red candles, each closing lower and leaving only a small lower wick.
Bearish Kicking
Bearish Kicking
A bullish marubozu is followed by a gap down and a bearish marubozu, marking a sharp sentiment shift from buyers to sellers.
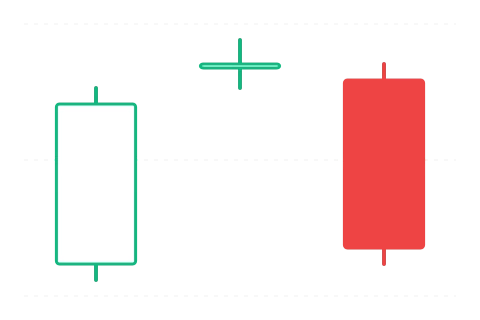
Evening Doji Star
Evening Doji Star
A stronger version of the Evening Star: the middle candle is a full doji, making the market’s indecision even clearer.
Bearish Abandoned Baby
Bearish Abandoned Baby
A three-candle pattern where the middle doji is fully isolated by gaps, creating a rare but strong bearish reversal signal.
Three Outside Down
Three Outside Down
Bearish engulfing confirmed by a third bearish candle, forming a three-candle reversal pattern at the end of an uptrend.
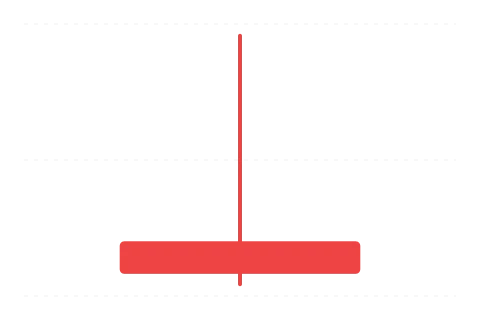
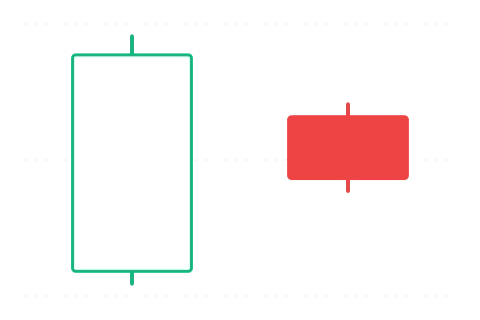
Shooting Star
Shooting Star
A bearish single-candle reversal pattern at the end of an uptrend, with a small lower body and a long upper wick.

Bearish Marubozu
Bearish Marubozu
A large red candlestick with virtually no wicks, showing clear seller dominance throughout the entire period.
Dark Cloud Cover
Dark Cloud Cover
A large green candle is followed by a large red candle that closes below the midpoint of the first body, warning of a reversal.
Three Inside Down
Three Inside Down
A bearish harami confirmed by a third bearish candle, signaling a gradual reversal after an uptrend loses momentum.
Falling Three Methods
Falling Three Methods
A bearish continuation pattern: a large red candle, three small green pullback candles inside its range, then another large red candle.

Hanging Man
Hanging Man
Visually identical to the Hammer, but appears after an uptrend; it warns that buying pressure is weakening.
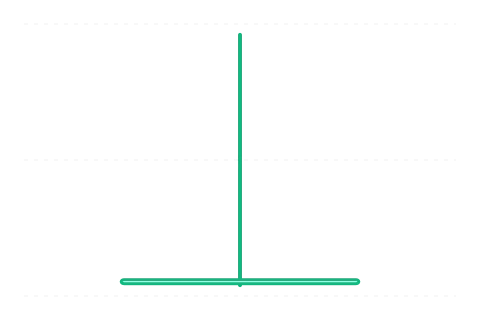
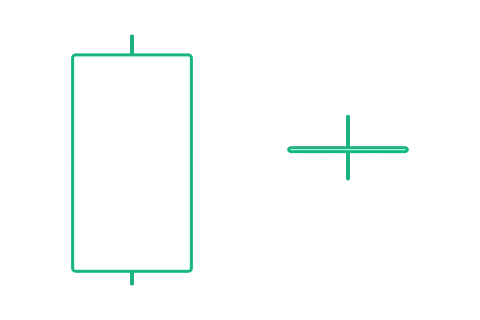
Gravestone Doji
Gravestone Doji
A doji with a long upper wick: buyers pushed price higher, but sellers drove it back to the open by the close.

Bearish Belt Hold
Bearish Belt Hold
A large red candle with no upper wick: it opens at the high, then price sells off through the session.
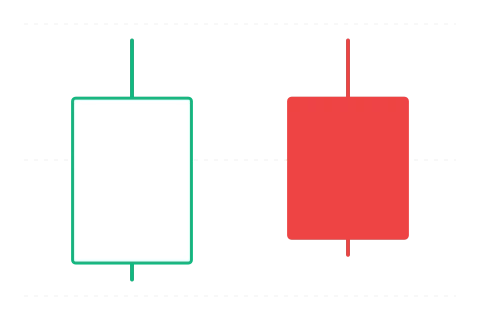
Bearish Harami
Bearish Harami
A large green candle followed by a small red body contained within the first body, signaling a possible stall in an uptrend.
Bearish Harami Cross
Bearish Harami Cross
A large green candle followed by a doji inside the first real body, signaling heightened indecision after an uptrend.
Tweezer Top
Tweezer Top
Two consecutive candles with matching highs, showing two failed attempts to break higher through the same level.
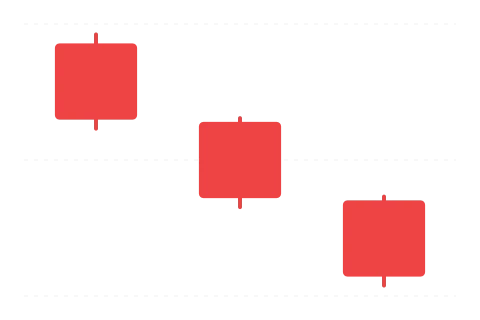
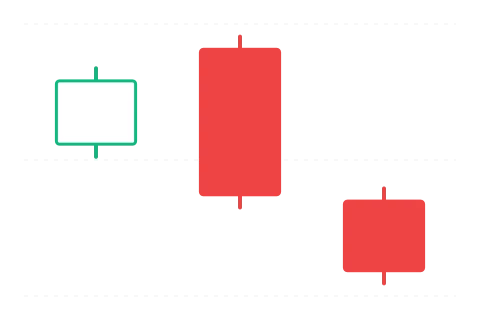
Advance Block
Advance Block
Three green candles with shrinking bodies and longer upper wicks warn that an uptrend is losing momentum.
When to trade bearish patterns
1. Trend context. Bearish reversal patterns are only meaningful at the end of an uptrend — not in sideways markets and not in an existing downtrend. A bearish engulfing at the top of a sharp rally is a strong signal; the same shape in the middle of a 2-week range is noise.
2. Confirmation candle. The most common mistake is entering immediately on the close of the pattern's last candle. Wait for the next period to confirm with a red candle — this filters out roughly a third of false signals.
3. Volume. Above-average volume (especially on the key candle, e.g. the third candle of an evening star) significantly improves the pattern's statistical reliability. A low-volume pattern is a weak signal.
4. Entry and stop loss. Enter on the open or close of the confirmation candle. Place the stop loss above the highest point of the pattern (typically a few ATRs above the upper wick). Take profit at a minimum 1:2 risk/reward ratio — if the next support level is closer than twice the stop distance, skip the setup.
5. Combine with other tools. Do not trade candlestick patterns alone. Combine them with a trend indicator (MA, EMA), a momentum indicator (RSI, MACD), support/resistance levels and Fibonacci levels. A bearish engulfing at major resistance, with overbought RSI and negative MACD divergence — that is a setup.
Common mistakes
- Trading without trend contextA shooting star in a sideways market or in an existing downtrend is not a reversal signal — it is just a random shape. Bearish reversals only show a positive statistical edge at the end of an uptrend.
- Skipping the confirmation candleThe close of the pattern's last candle is not a guarantee — wait for the next period's confirming red candle. This is the single biggest source of false signals.
- Stop loss inside the pattern's bodyThe stop loss belongs above the highest point of the pattern (above the upper wick), not at the body's top. A tight stop is taken out by normal noise before the pattern can play out.
- Trading short time frames (1m, 5m)Bearish-pattern reliability collapses on short time frames — the noise-to-signal ratio is too poor. Daily (D1) and weekly (W1) work best; 4-hour (H4) is acceptable.
- Using a single indicatorA candlestick pattern alone is not an entry signal — combine it with a resistance level, RSI, moving average or volume. Multiple signals together produce statistically better setups.