Inverted Hammer
Inverted Hammer
A bullish reversal candlestick pattern with a small lower body and a long upper wick, appearing near the end of a downtrend.
30-second summary
What does it signal?
A one-candle reversal signal that appears near the end of a downtrend, with a small lower body and a long upper wick. Buyers tried to move price higher but were pushed back — still, it signals that momentum may be shifting.
When is it reliable?
Only with a confirming green candle in the next period, since the pattern is weak on its own. At support and with above-average volume, the reversal becomes more credible.
When to avoid it?
In an uptrend, the same formation is a Shooting Star with bearish meaning. Trading it without confirmation has a high failure rate.
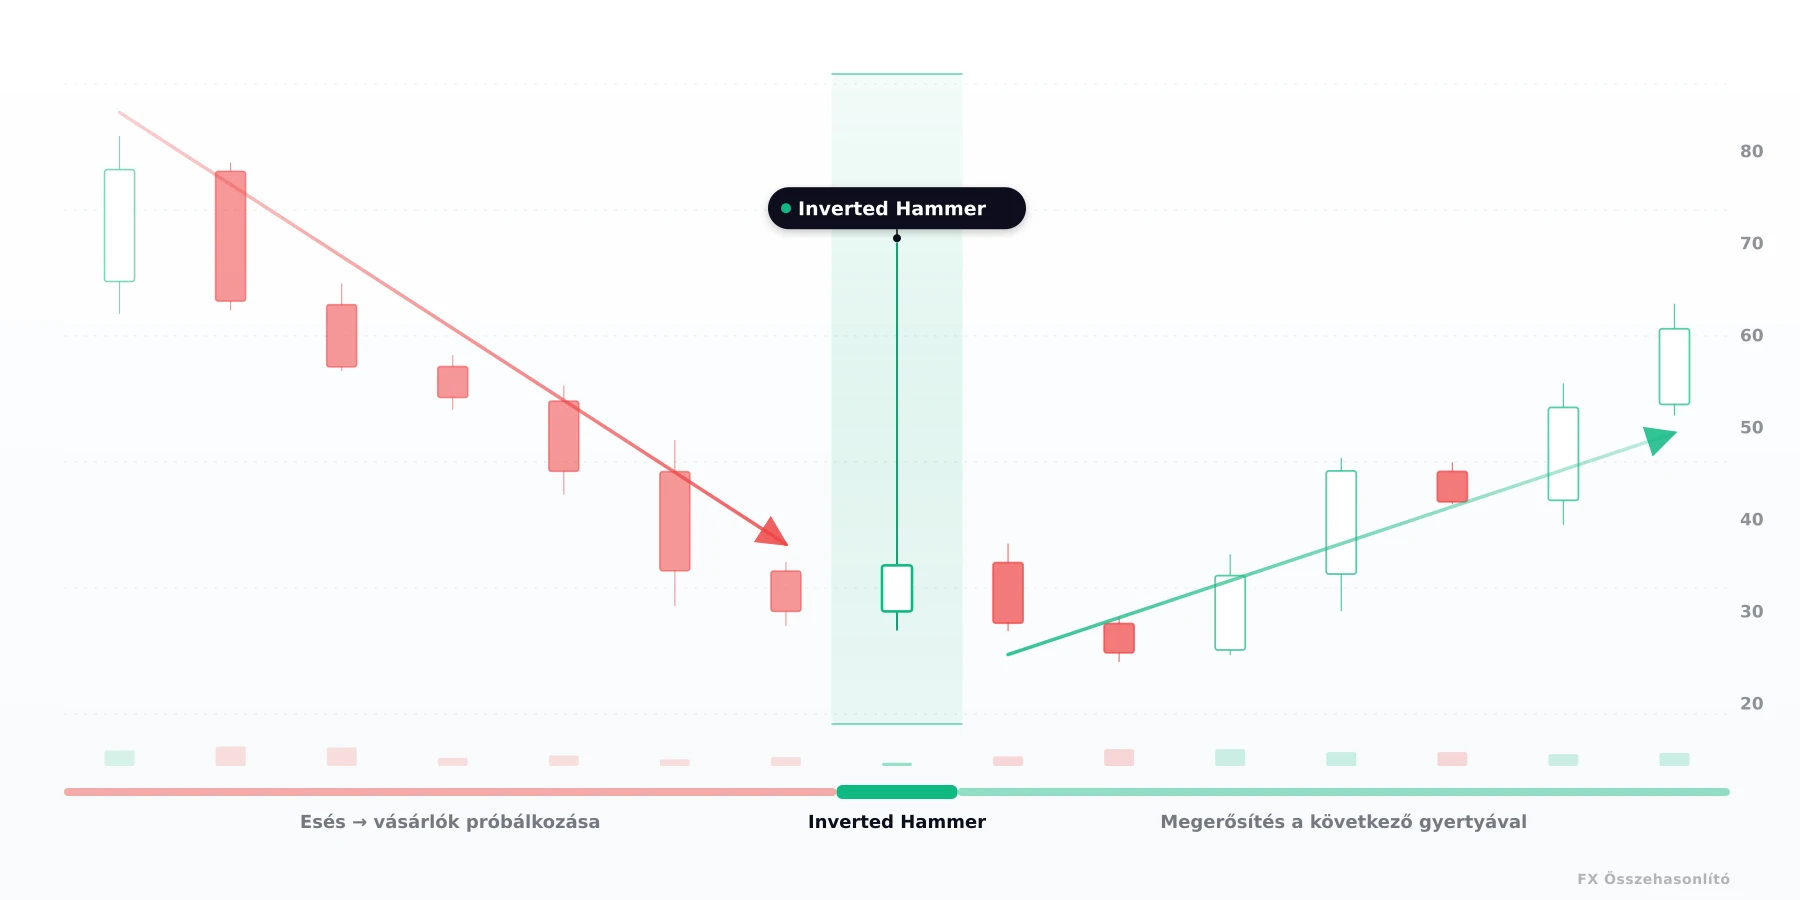
Pattern in chart context
The chart shows the typical appearance of the Inverted Hammer pattern within a price action context. The highlighted area marks the pattern itself. Data is illustrative.
Market psychology — in 3 steps
Downtrend continues
The market is moving lower, sellers still dominate, and sentiment remains negative.
Upper wick probes higher
After the open, buyers try to push price higher and briefly succeed, but sellers force it back down. The body still closes near the open, showing that buyers remain weak.
Green candle needed
On its own, the Inverted Hammer is not enough. Entry is considered only after the next green candle closes above it, which makes a reversal more likely.
Description
The Inverted Hammer shows that buyers made an early attempt to push price higher during a downtrend. Sellers forced price back down by the close, but the failed upside move still warns that bearish momentum may be weakening. The real body sits in the lower third of the candle, and the upper wick is at least twice the size of the body. Confirmation is needed from a green candle in the next session.
Context of appearance
The pattern appears near the end of a downtrend, preferably close to support. The same visual shape in an uptrend is a Shooting Star, which has the opposite meaning.
Identification rules
- ✓ Valid only near the end of a downtrend
- ✓ The upper wick is at least twice the size of the real body
- ✓ The lower wick is no more than 25% of the body
- ✓ Weaker as a standalone signal than the classic Hammer
- ✓ A confirming bullish candle is needed before entry
Trading strategy
Wait for the confirming green candle. Entry comes after that candle closes. Place the stop-loss below the low of the Inverted Hammer. Take profit at the next resistance level.
⚠️ For educational purposes only. Trading based solely on candlestick patterns carries elevated risk — combine them with other technical analysis tools, support/resistance levels, and risk management.
Candle anatomy
- 01 Small real body in the lower third of the candle
- 02 Long upper wick — at least twice the size of the body
- 03 Lower wick is short or absent
- 04 The shape resembles an upside-down hammer
Same shape, opposite meaning
The Inverted Hammer and the Shooting Star look visually identical. The difference lies in context — if you mistake one for the other, you enter in the opposite direction.

💡 The lesson: the candle shape alone is never enough — always read the trend first, then the pattern.
Most common mistakes
Trading it alone
The Inverted Hammer is one of the weaker bullish signals. Avoid entering on this pattern alone; the confirming green close is needed.
Confusing it with the Shooting Star
The shape is exactly the same, but the context is different: in a downtrend it is an Inverted Hammer and bullish; in an uptrend it is a Shooting Star and bearish. Check the trend first.
Ignoring volume
With low volume, the Inverted Hammer often means little and may be just noise. Above-average volume paired with a long wick gives the signal more weight.
Using very short time frames
On 5-minute to 15-minute charts, the Inverted Hammer produces many false signals. It is more reliable on 4-hour and daily charts.
Quick self-test
Which one is the Inverted Hammer?
A reversal signal near the end of a downtrend.