Candlestick Patterns
A structured catalog of 41 Japanese candlestick patterns. Each pattern comes with a visual anatomy, identification rules, market psychology and practical use. Patterns are grouped into three families — bullish, bearish and neutral.
Updated: May 24, 2026 · FX Editorial Team
No patterns found
Try a different filter or search term.
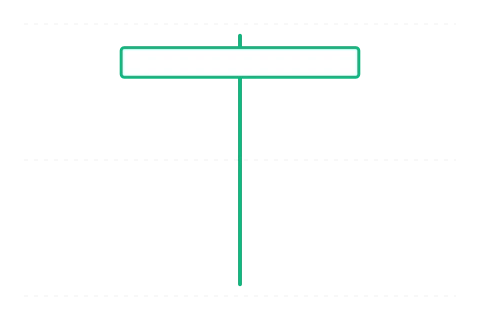
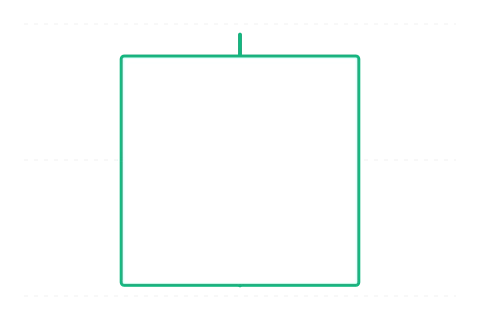
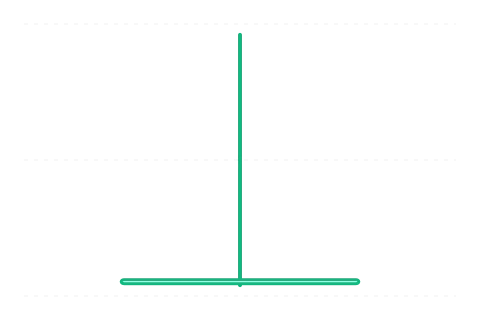
Hammer
Hammer
A one-candle bullish reversal pattern that appears after a downtrend, with a small body near the top and a long lower wick.
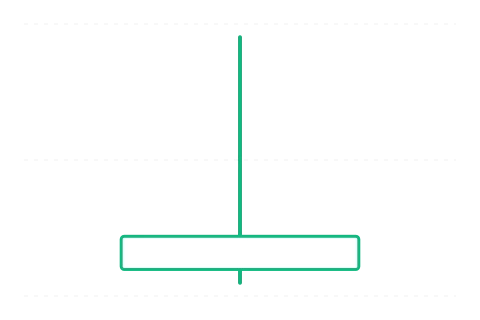
Inverted Hammer
Inverted Hammer
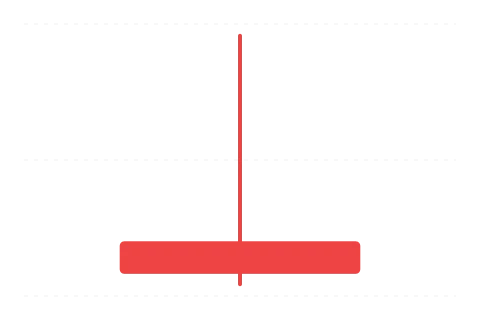
A bullish reversal candlestick pattern with a small lower body and a long upper wick, appearing near the end of a downtrend.
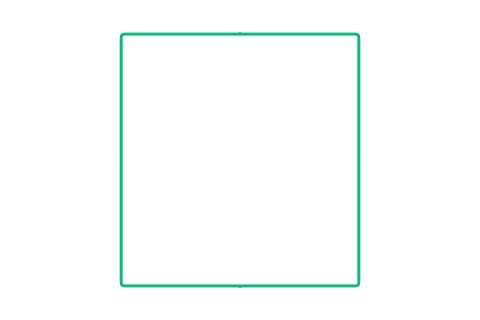
Bullish Marubozu
Bullish Marubozu
A large green candle with virtually no wicks, showing clean buyer dominance from the open through the close.
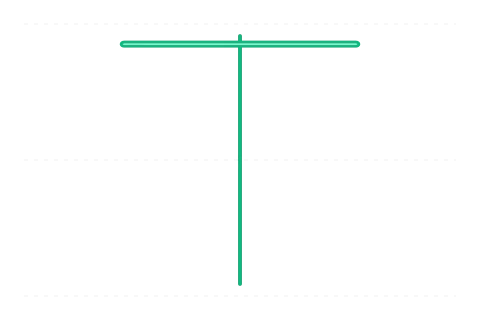
Dragonfly Doji
Dragonfly Doji
A doji with a long lower wick: sellers pushed price down, but buyers drove it back to the open by the close.
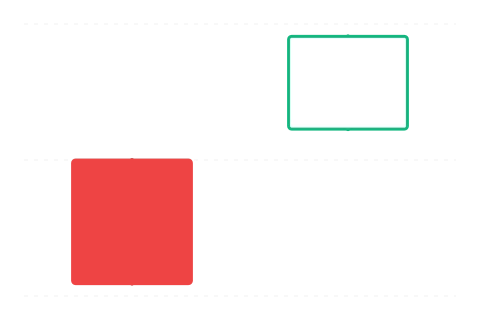
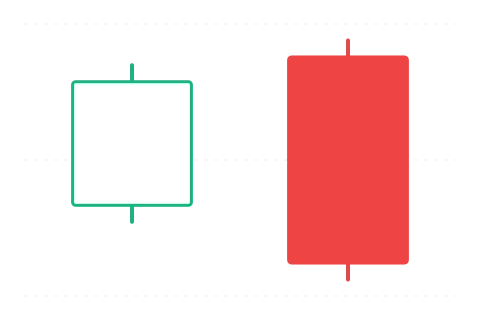
Bullish Engulfing
Bullish Engulfing
A two-candle bullish reversal pattern where a large green body fully engulfs the previous small red body.
Piercing Line
Piercing Line
A bullish two-candle reversal pattern where a large green candle closes above the midpoint of the prior red candle.
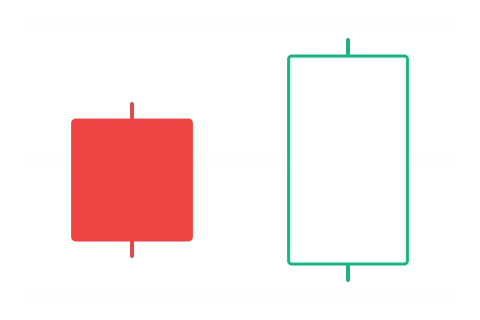
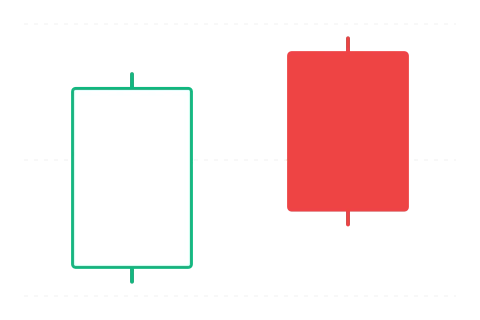
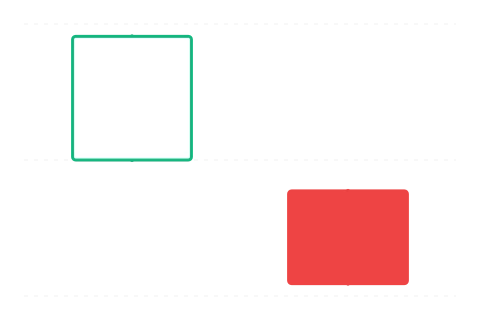
Bullish Harami
Bullish Harami
A large red candle is followed by a small green body that sits entirely inside the first candle’s body.
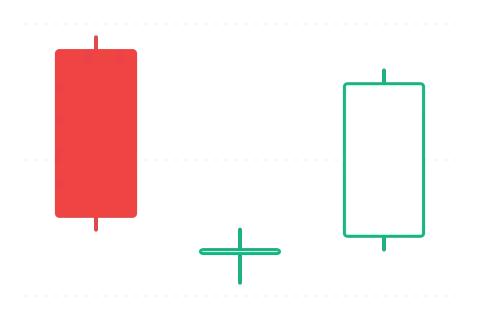
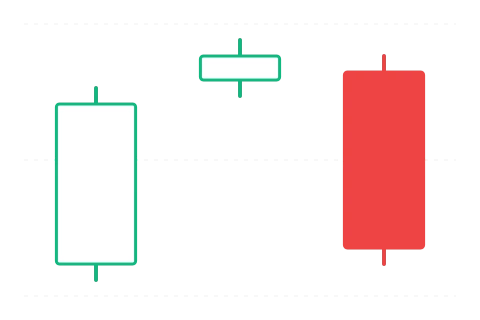
Morning Star
Morning Star
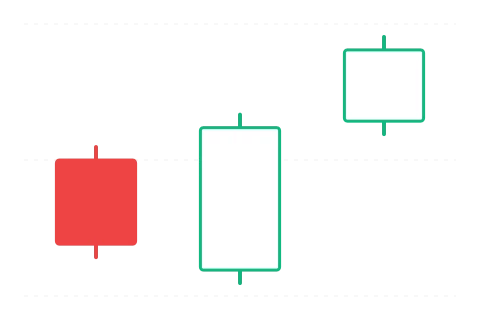
A three-candle bullish reversal pattern: large red candle, small indecision candle, then large green candle as sentiment shifts.
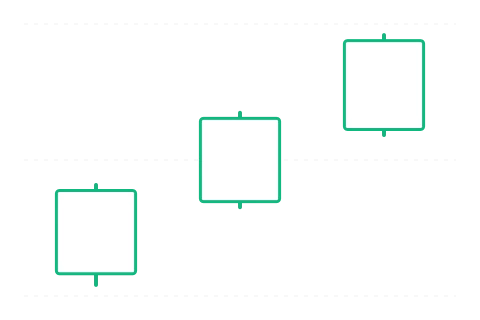
Three White Soldiers
Three White Soldiers
Three consecutive large green candles, each closing higher and leaving only a small upper wick.
Bullish Belt Hold
Bullish Belt Hold
A large green candle with no lower wick: price opens at the period low and rises through the session.
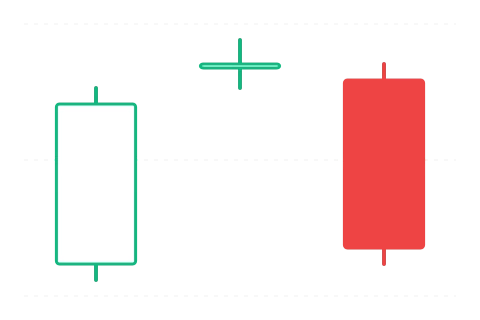
Bullish Harami Cross
Bullish Harami Cross
A large red candle followed by a doji contained within the first body, showing a sharp rise in indecision after a downtrend.
Tweezer Bottom
Tweezer Bottom
Two consecutive candles share the same low, showing two failed attempts to break lower and a possible bullish reversal.
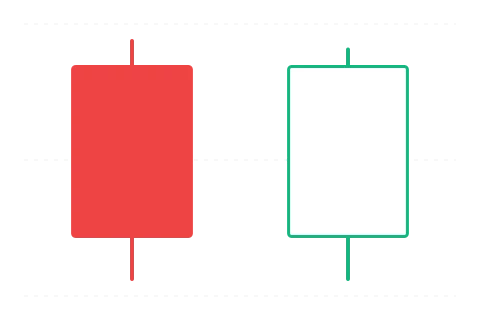
Bullish Kicking
Bullish Kicking
A bearish marubozu is followed by a bullish marubozu after an upside gap, marking a sharp sentiment shift from one session to the next.
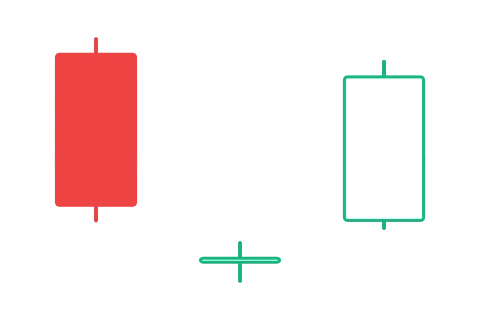
Morning Doji Star
Morning Doji Star
A stronger Morning Star variant: the middle candle is a full doji, making the market’s uncertainty more visible.
Bullish Abandoned Baby
Bullish Abandoned Baby
A three-candle bullish reversal pattern with a fully isolated doji between two gaps — extremely rare and often a strong signal.
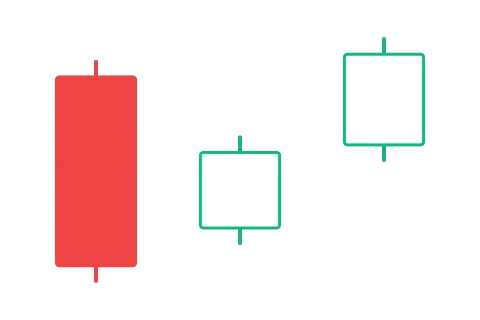
Three Inside Up
Three Inside Up
A bullish harami confirmed by a third bullish candle, signaling a gradual reversal attempt after a downtrend.
Three Outside Up
Three Outside Up
A bullish engulfing pattern confirmed by a third bullish candle, forming a three-candle reversal signal.
Rising Three Methods
Rising Three Methods
A bullish continuation pattern: one large green candle, three small red pullback candles inside its range, then another strong green candle.
Hanging Man
Hanging Man
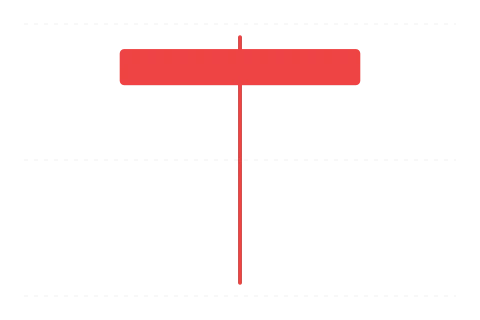
Visually identical to the Hammer, but appears after an uptrend; it warns that buying pressure is weakening.
Shooting Star
Shooting Star
A bearish single-candle reversal pattern at the end of an uptrend, with a small lower body and a long upper wick.

Bearish Marubozu
Bearish Marubozu
A large red candlestick with virtually no wicks, showing clear seller dominance throughout the entire period.
Gravestone Doji
Gravestone Doji
A doji with a long upper wick: buyers pushed price higher, but sellers drove it back to the open by the close.
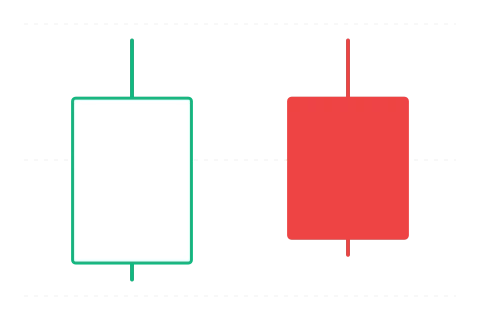
Bearish Engulfing
Bearish Engulfing
A two-candle bearish reversal pattern where a large red body fully engulfs the prior small green body after an uptrend.
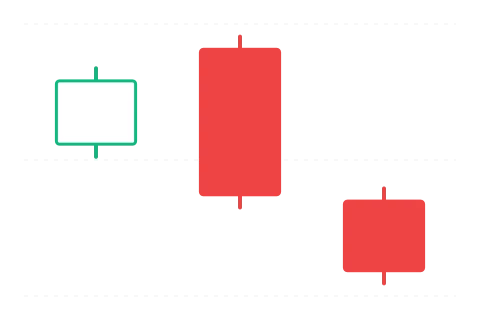
Dark Cloud Cover
Dark Cloud Cover
A large green candle is followed by a large red candle that closes below the midpoint of the first body, warning of a reversal.
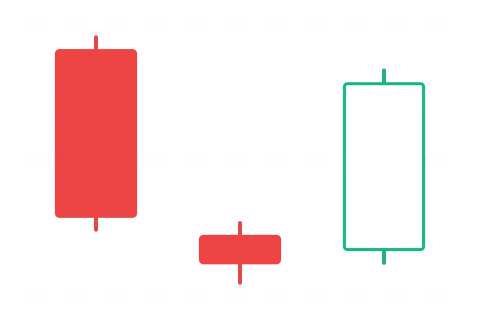
Evening Star
Evening Star
A three-candle bearish reversal pattern: large green candle, small indecision candle, then large red candle as sentiment deteriorates.
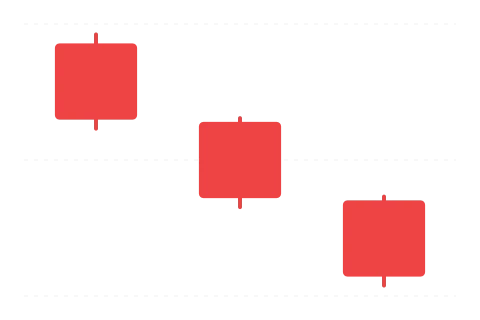
Three Black Crows
Three Black Crows
Three consecutive large red candles, each closing lower and leaving only a small lower wick.

Bearish Belt Hold
Bearish Belt Hold
A large red candle with no upper wick: it opens at the high, then price sells off through the session.
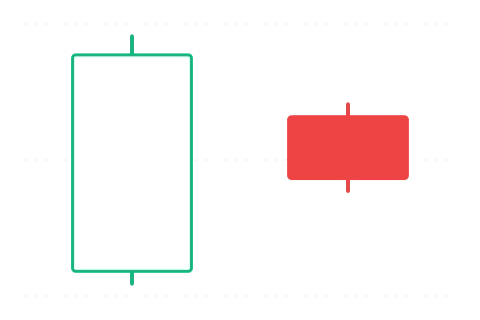
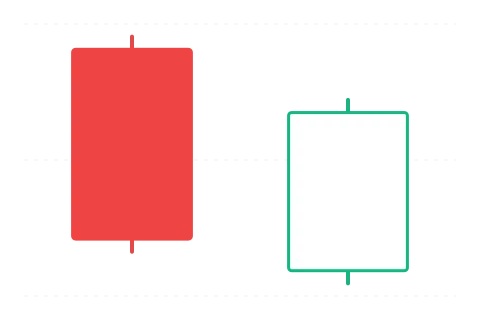
Bearish Harami
Bearish Harami
A large green candle followed by a small red body contained within the first body, signaling a possible stall in an uptrend.
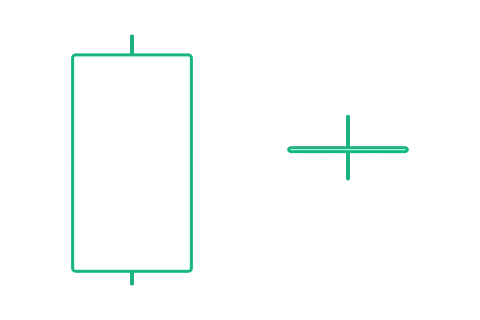
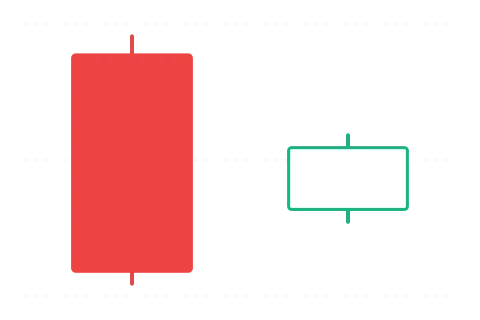
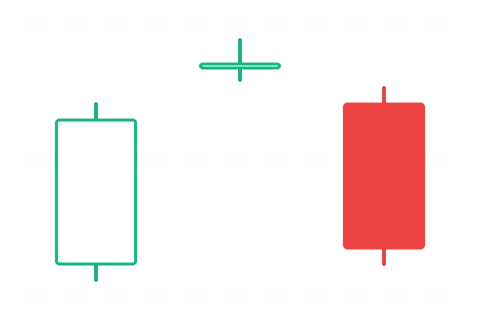
Bearish Harami Cross
Bearish Harami Cross
A large green candle followed by a doji inside the first real body, signaling heightened indecision after an uptrend.
Tweezer Top
Tweezer Top
Two consecutive candles with matching highs, showing two failed attempts to break higher through the same level.
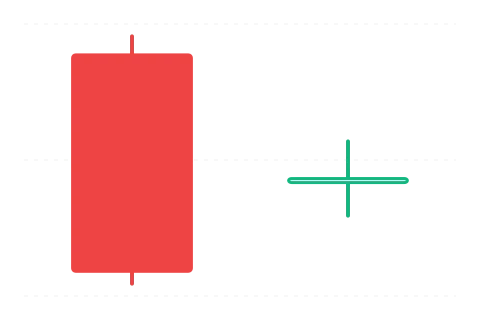
Bearish Kicking
Bearish Kicking
A bullish marubozu is followed by a gap down and a bearish marubozu, marking a sharp sentiment shift from buyers to sellers.
Evening Doji Star
Evening Doji Star
A stronger version of the Evening Star: the middle candle is a full doji, making the market’s indecision even clearer.
Bearish Abandoned Baby
Bearish Abandoned Baby
A three-candle pattern where the middle doji is fully isolated by gaps, creating a rare but strong bearish reversal signal.
Three Inside Down
Three Inside Down
A bearish harami confirmed by a third bearish candle, signaling a gradual reversal after an uptrend loses momentum.
Three Outside Down
Three Outside Down
Bearish engulfing confirmed by a third bearish candle, forming a three-candle reversal pattern at the end of an uptrend.
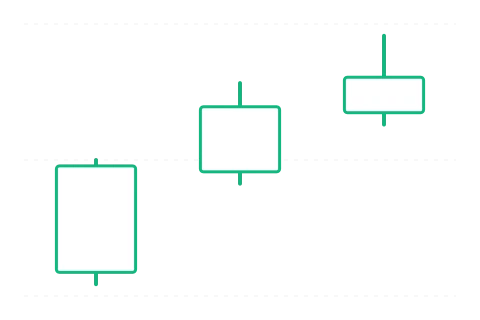
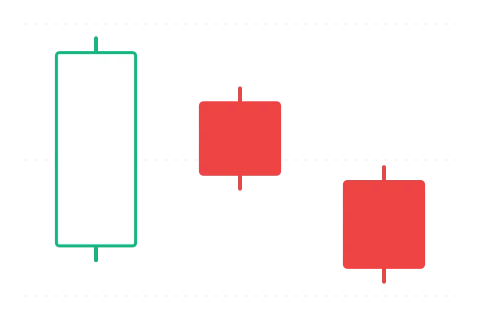
Advance Block
Advance Block
Three green candles with shrinking bodies and longer upper wicks warn that an uptrend is losing momentum.
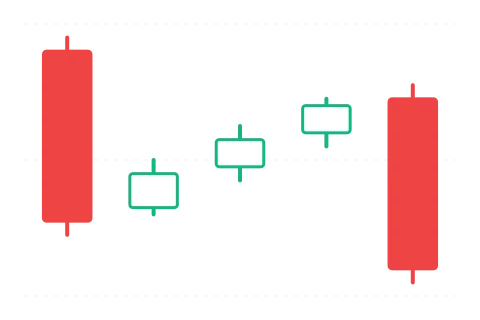
Falling Three Methods
Falling Three Methods
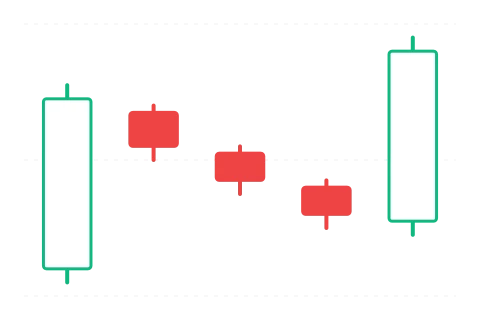
A bearish continuation pattern: a large red candle, three small green pullback candles inside its range, then another large red candle.
Doji
Doji
Open and close are nearly identical, showing balance between buyers and sellers and a moment of market indecision.
Spinning Top
Spinning Top
A small real body with wicks on both sides, showing uncertainty as neither buyers nor sellers take clear control.
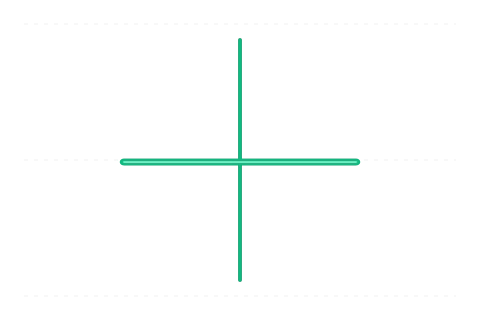
Long-Legged Doji
Long-Legged Doji
A doji with extremely long upper and lower wicks, showing extreme volatility and broad market indecision.
High Wave
High Wave
A small real body with extremely long upper and lower wicks, showing extreme volatility and a complete loss of direction.
A Japanese candle carries four data points
Each candle represents a single time period — one minute, one hour, one day. The four important values are: the opening price, the closing price, and the highest and lowest prices reached during that period. The body shows the range between open and close, and the thin lines (wicks or shadows) show the extreme moves.
A green or hollow body means the close was higher than the open (buyers won). A red or filled body means the close was lower than the open (sellers won). The wick length tells its own story — a long upper wick shows that the market tried to push higher but was rejected.
What beginners get wrong
Reading the pattern in isolation
A Hammer only matters at the end of a downtrend. In a sideways market the same shape is statistically useless. Read the trend first, then look at the candle.
Trading on short timeframes
Noise on 1-minute candles is too high. Patterns are more reliable on daily and weekly charts. As a beginner, look at the daily — not the 5-minute.
Ignoring volume
A reversal pattern on low volume is less credible than one backed by heavy participation. Volume gives the candle its weight.
Skipping the confirmation
Experienced traders do not enter on the close of the pattern candle — they wait for the next candle to confirm the signal. The entry price is slightly worse, but false signals drop sharply.
No risk management or stop-loss
A candlestick pattern never signals with 100% certainty. Every entry needs a stop-loss and a pre-sized position. The pattern only refines the entry timing — it does not replace risk management.