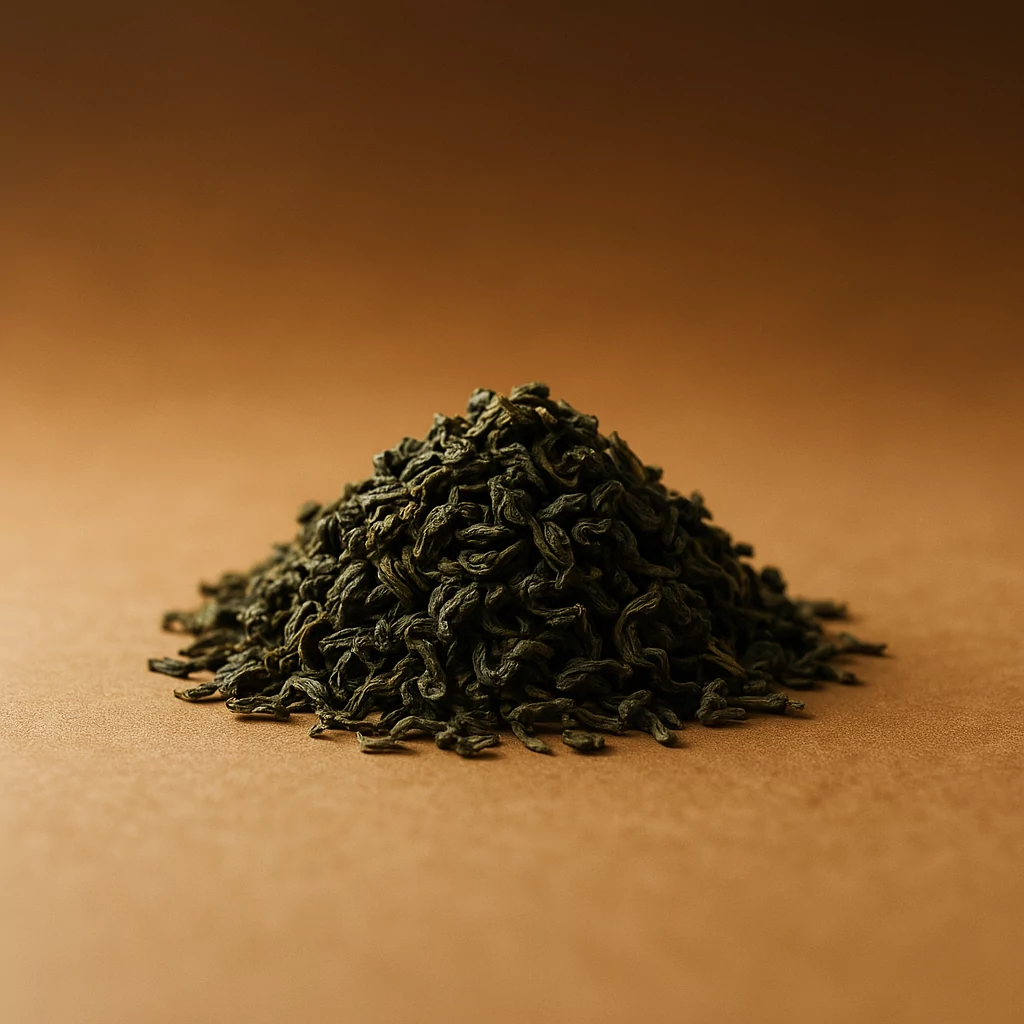
Soft commodities · TEA

Tea price

Tea currently trades at US$220.62 per kg (≈ €187.63 · £164.43) — effectively at the 12-month high. Over the past 12 months it has gained 15.73%, with the annual range running from US$118.99 to US$220.62. 24-hour movement is minimal (±0.00%).

US$220.62 / kg
≈ €187.63 ≈ £164.43 Unchanged 24h 100% within the 52-week range
FX Editorial Team · Data updated: · Editorially verified
Tea (TEA) price today US$220.62 / kg, ↑ +0.00% (24h)

Tea chart

Interactive chart and 30-day overview

7 days
Unchanged
30 days
▲ +21.26%
+US$38.68
1 year
▲ +15.73%
+US$29.99
52-week range
US$118.99 100% US$220.62
Tea (TEA) 30-day price chart — USD, EUR, GBP

The Tea chart shows how the tea price has moved over time. The interactive view lets you switch the timeframe (from 7 days up to MAX), the currency (USD / EUR / GBP) and overlay moving averages. Click any two points to measure the percentage change between those dates.

How is tea priced?

Tea is priced per kilogram — the standard metric unit for high-value or specialty commodities including industrial gases and rare-earth metals. The kilogram unit reflects retail and small-batch industrial pricing rather than bulk wholesale.

At US$220.62 per kilogram, 100 grams costs US$22.06 and one tonne US$220,620. Larger industrial buyers typically negotiate volume discounts off the published kilogram benchmark.

What moves the price of tea?

The main structural feature of the tea market is supply concentration in East Africa and South Asia. Global tea output is about 6.5 million tonnes a year, according to the FAO Tea Market Outlook. The largest producer is China, with about 3 million tonnes a year (~46%), but most of its crop is consumed domestically. India produces about 1.35 million tonnes a year and consumes roughly 1.1 million tonnes itself. The export market is therefore shaped mainly by Kenya (about 570 kt a year, the world’s largest tea exporter) and Sri Lanka (~250 kt). In that sense, the Mombasa Tea Auction sets the global reference price for CTC black tea. Turkey (~210 kt, mainly for domestic black-tea consumption) and Vietnam form the next tier. Many plantations are centuries-old monocultures. Much of the Kenyan and Sri Lankan tea industry rests on estates planted during the British colonial period. Ageing bushes and the migration of younger workers are structural supply risks.

Short-term price volatility is driven mainly by weather in the main growing regions. In Kenya, tea estates in the Rift Valley and around Mount Kenya are sensitive to the distribution of the two annual rainy seasons — the long rains from March to May and the short rains from October to December. Drought quickly cuts the weekly harvest of two leaves and a bud. Excessive rain can also overwhelm factories handling fresh leaf. In Sri Lanka, high-grown estates in Nuwara Eliya, Dimbula and Uva are shaped by the opposing cycles of the south-west and north-east monsoons. The country’s economic crisis, fertiliser import ban and shortage of foreign currency left a lasting shock on Ceylon-tea supply. In India, the main risks are monsoon distribution and climate warming in Assam and Darjeeling, where Darjeeling’s cool highland microclimate is narrowing. In China, the main risk is spring frost in producing areas such as Yunnan and Fujian.

Demand is shaped by the procurement cycles of large importing countries and international tea-bag brands. The largest importers include Pakistan (about 200 kt a year, almost entirely Kenyan CTC), Russia, Egypt, the United Kingdom and Iran. Iranian imports are persistently affected by US sanctions and currency moves, which also influence the grey channels of global tea trade. The branded processing side is concentrated. Lipton Teas and Infusions (Lipton, PG Tips, Brooke Bond — formerly ekaterra, owned by CVC Capital Partners) and Tata Consumer Products (Tetley, Tata Tea) are the two largest players in the global tea-bag market. Large importer tenders and the renewal of long-term processor contracts can move weekly auction prices materially.

How to invest in tea

Tea has no listed futures contract. There is no direct tea CFD at XTB or eToro either, because physical trade is auction-based (Mombasa, Colombo, Kolkata), not based on a standardised exchange listing. For a European retail investor, tea exposure is therefore built through individual shares in the consumer-goods value chain. The most direct exposure is Tata Consumer Products (ticker: TATACONSUM.NS, NSE Mumbai), the parent company of the Tetley tea-bag brand and the second-largest integrated player in the global tea market. Unilever (ticker: UL NYSE / ULVR.L London) historically owned Lipton and Brooke Bond. It sold the tea business under the “ekaterra” name and is now mainly exposed through indirect links to beverages. Nestlé (NESN.SW) offers tea exposure through the Nestea brand. Two regulated brokers offering access to related global shares:

30-day price history

Chart and daily closing prices

Tea (TEA) 30-day price chart — USD, EUR, GBP

Daily close

30 trading days

Date Price (USD) Price (EUR) Price (GBP) Daily change
15 May 2026 US$220.62 €187.63 £164.43 ▲ +10.50%
3 May 2026 US$199.66 €169.80 £148.81 ▲ +9.74%
20 Apr 2026 US$181.94 €154.73 £135.60

Tea: frequently asked questions

Why is there no exchange-traded futures market for tea? +
The structure of the tea market does not support an exchange-traded futures contract. Global tea output is about 6.5 million tonnes a year, but traded volumes are fragmented across thousands of quality grades — CTC versus orthodox, black versus green, down to individual estate “marks”. Tea’s organoleptic qualities, such as taste, aroma and leaf size, are assessed through cupping, or expert tasting. That degree of quality heterogeneity prevents exchange standardisation. Pricing takes place in weekly physical auctions: Mombasa for Kenyan and East African CTC, Colombo for Sri Lankan Ceylon tea, Kolkata for Indian Assam and Darjeeling, and smaller markets such as Guwahati and Chittagong. The FAO Tea Composite Price Index and the International Tea Committee (ITC) reference indicators are built on these auction averages.
How much tea does the world produce, and who are the largest producers? +
According to the FAO Tea Market Outlook, global tea output is about 6.5 million tonnes a year. The largest producers are China, with about 3 million tonnes a year (~46%, mainly for domestic green-tea consumption); India, with ~1.35 million tonnes from Assam, Darjeeling and Nilgiri estates; Kenya, with ~570,000 tonnes as the world’s largest tea exporter, almost entirely CTC black tea; Sri Lanka, with ~250,000 tonnes of Ceylon tea, a mix of high-grown orthodox and mid-grown CTC; and Turkey, with ~210,000 tonnes from the Rize region, mostly for domestic consumption. The remaining supply comes from Vietnam, Indonesia, Argentina, Bangladesh and Malawi.
What is the difference between CTC and orthodox tea? +
The two processing methods produce different end products. CTC stands for Crush-Tear-Curl, a mechanical process developed in Assam from the first half of the 20th century. Fresh leaves are crushed, torn and curled between rollers, producing small, uniform granules. CTC tea brews quickly and strongly, which makes it the main input for the tea-bag industry, including Lipton, Tetley and PG Tips. The orthodox process uses gentler rolling and longer fermentation, preserving the long, intact leaf. Most Darjeeling, high-grown Ceylon and premium Chinese black teas are orthodox. In global trade, black tea accounts for about 75% of volume and green tea for ~25%. Other categories, such as oolong, white tea and pu-erh, are small premium segments.
How does the Mombasa Tea Auction work? +
The Mombasa Tea Auction is the world’s largest tea auction. It is held weekly in the Kenyan port city and organised by the East African Tea Trade Association (EATTA). The auction handles CTC black tea from Kenya, Uganda, Rwanda, Burundi, Tanzania and Malawi. Estate-level “mark” samples are assessed in advance through cupping, then bid on by grade. On the seller side, the main participants include the Kenya Tea Development Agency (KTDA), the umbrella co-operative for smallholders that accounts for about 60% of Kenya’s crop, and large private estate owners such as Williamson Tea and Eastern Produce Kenya. On the buyer side, Unilever, Tata, James Finlay and Iranian, Pakistani and Egyptian importers tender for supply. Weekly average prices feed directly into the FAO Tea Composite Price Index.
How much tea do China, India and the other large markets consume? +
Global tea consumption has a distinct structure. China consumes about 2.7 million tonnes of tea a year, mostly domestic green tea. India consumes ~1.1 million tonnes, mainly CTC black tea in “chai” form with milk and spices. In the import market, Pakistan is the world’s largest tea importer, buying about ~200,000 tonnes a year of Kenyan CTC. Russia, the United Kingdom, Egypt and Iran form the next large importer group. Sanctions on Iran continue to distort global trade flows. A significant share of Iranian tea imports arrives through indirect channels and third countries, which also affects auction price and volume statistics.
What was the impact of the Sri Lankan crisis on tea prices? +
Sri Lanka fell into a deep economic and foreign-exchange crisis. The country ran down its foreign-currency reserves, and the government of the time banned imports of fertiliser and crop-protection chemicals as an early step in a “100% organic agriculture” policy. The decision immediately and severely reduced tea yields. Ceylon-tea supply fell by about 20–30% for several quarters, while one of the main global sources of high-grown orthodox tea tightened. The price effect showed up in Colombo Tea Auction averages and in the global premium black-tea benchmark. The fertiliser ban was later lifted and foreign-currency shortages were eased by international rescue packages, but the plantation system’s recovery is a multi-year process. Structural supply risk remains.
What are the FAO Tea Composite Price and the International Tea Committee? +
The FAO Tea Composite Price is a monthly reference price index published by the UN Food and Agriculture Organization. It is calculated on a weighted basis from weekly closing prices at the main tea auctions, including Mombasa, Colombo, Kolkata, Cochin, Jakarta and Limuru. It sits within the FAO Intergovernmental Group on Tea (IGG/Tea), and is cited by member-country governments and global tea processors in long-term contracts. The International Tea Committee (ITC), based in London, is the tea industry’s oldest statistical body. It publishes the Annual Bulletin of Statistics, a global reference collection for production, export, import and consumption data. Weekly releases from KTDA and the Mombasa Tea Auction refine the short-term market picture.
How can a European retail investor access the tea market? +
Because there is no tea CFD and no tea ETF for retail investors, tea exposure can only be built through individual shares in the consumer-goods value chain. The most direct proxy is Tata Consumer Products (TATACONSUM.NS) on the NSE in Mumbai — the parent company of Tetley and the second-largest integrated player in the global tea market. Unilever (UL / ULVR.L) is now mainly exposed through indirect beverage links after selling the Lipton tea-bag business. Nestlé (NESN.SW) offers tea exposure through the Nestea brand. Because the market is highly concentrated and physical tea auction pricing is opaque, tea is a structurally difficult commodity to invest in compared with cocoa, coffee or sugar. Tax treatment varies by jurisdiction; consult a local tax adviser.