CHE Cheese price
Cheese currently trades at US$1.58 per pound (≈ €1.39 · £1.18) — 14.59% below the 12-month high. Over the past 12 months it has lost 9.71%, with the annual range running from US$1.40 to US$1.85. In the past 24 hours the price has fallen by 1.25%.
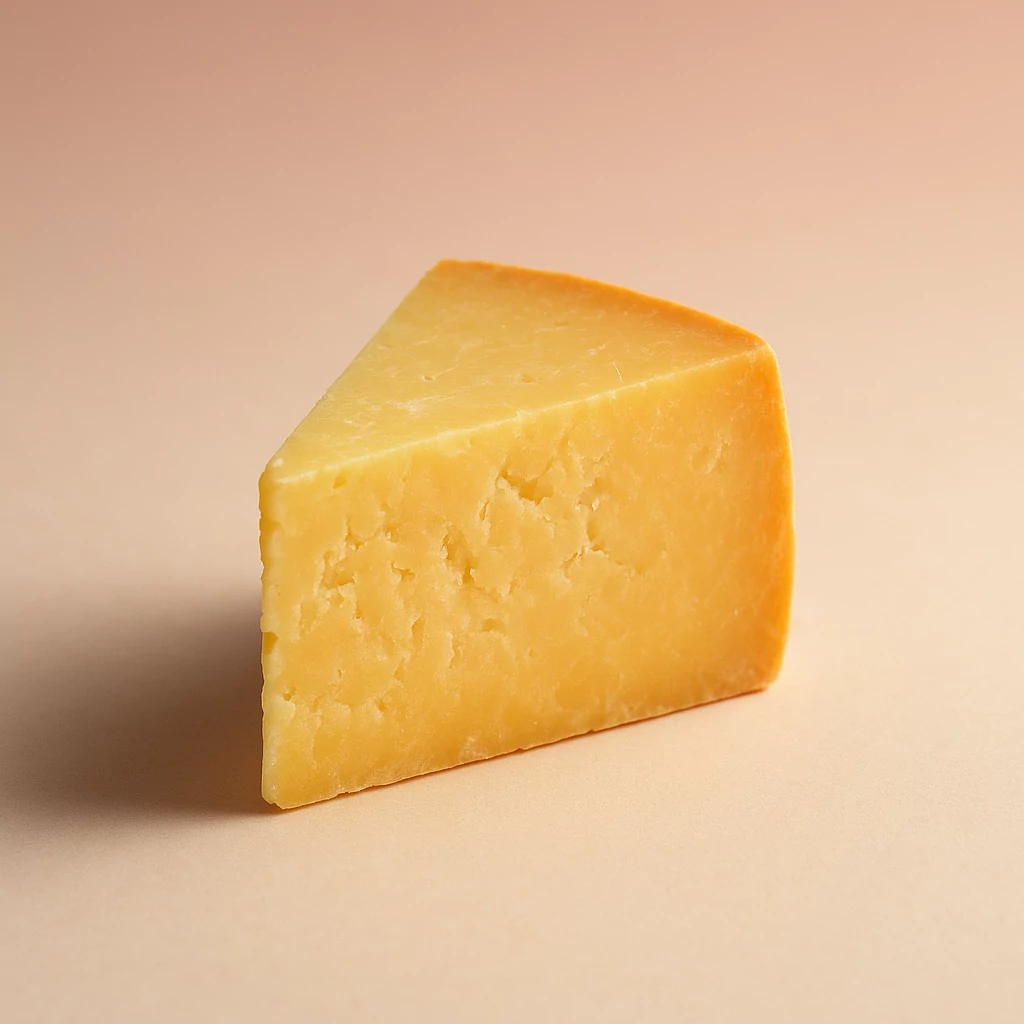
Cheese chart
Interactive chart and 30-day overview

The Cheese chart shows how the cheese price has moved over time. The interactive view lets you switch the timeframe (from 7 days up to MAX), the currency (USD / EUR / GBP) and overlay moving averages. Click any two points to measure the percentage change between those dates.
How is cheese priced?
Cheese is quoted per pound (1 lb = 0.4536 kg) on the major US futures exchanges, including the COMEX, CME and ICE. The pound is the legacy commercial unit for North American agricultural and metals contracts.
At US$1.58 per pound, one kilogram costs about US$3.48. Industrial buyers usually negotiate in tonnes, while retail or specialty trade still references the pound — particularly for soft commodities and base-metal cathodes.
What drives the price of cheese?
The main input behind the cheese price is the raw milk price. Cheese is the most valuable end product in the Class III Milk category used in the US Federal Milk Marketing Order system. Class III Milk covers raw milk used to make cheese. The official monthly Class III Milk price is calculated by the US Department of Agriculture (USDA AMS) from USDA NDPSR prices for cheese, butter and whey: higher cheese prices lift the Class III Milk price, and vice versa. Producing one kilogram of cheddar requires about 10 kg of raw milk, and raw milk accounts for 50–60% of a processor’s cost base. The two benchmarks are therefore closely correlated. Dairy farm profitability — a major part of milk-producer revenue — is directly linked to the CME cheese quotation.
Demand is dominated by the foodservice segment. The structural driver of US cheese consumption is the pizza industry: combined mozzarella demand from Domino's, Pizza Hut, Papa John's, Little Caesars and independent pizzerias is one of the most important monthly drivers. About 35–40% of total US cheese production is mozzarella, and foodservice is the dominant channel within that category. Sales data from pizza chains, US restaurant traffic indices, Black Box Intelligence and the Restaurant Performance Index are therefore early indicators for cheese prices. The retail dairy shelf — cheddar, monterey jack and Swiss cheese — is a slower-moving and more stable segment. Foodservice is more sensitive to the economic cycle: in recessions, hospitality demand weakens and cheese prices come under pressure. USDA Foreign Agricultural Service dairy reports, together with monthly export data and domestic use, provide the broader demand picture.
Export demand is the third major driver of cheese prices. US cheese exports have been on a growth path in recent years and account for about 5% of total US cheese production — roughly 0.4 million tonnes a year. The main buyers are Mexico, the largest single market, followed by South Korea and Japan. Global cheese production is about 24 million tonnes a year. The EU produces about 10 million tonnes of that total, led by the Netherlands, Germany, France, Italy and Ireland. The United States produces 6.5 million tonnes, Brazil 0.8 million tonnes and New Zealand 0.4 million tonnes. New Zealand is a key player in global dairy exports despite its small production base. Dutch, Irish and French exporters are the main competitors to US suppliers in the Mexican, Japanese and Korean markets. Monthly price signals and export statistics from the EU Milk Market Observatory are among the best indicators of the global balance.
How to invest in cheese?
Cheese is usually not available as a direct CFD through retail brokers. Liquidity in CME Cheese Futures and cheese options is relatively low, and neither XTB nor eToro offers cheese as a standalone contract. Retail exposure is therefore usually built through listed companies in the global dairy-processing industry. Toronto-listed Saputo (SAP.TO) is one of the world’s largest cheese and dairy companies, with a significant US business through Saputo Cheese USA and a European presence. Ireland’s Glanbia (GLB.IR) is an important player in the US cheddar and mozzarella markets through its US subsidiaries. France’s Savencia (SAVE.PA) is focused on branded cheeses, while the US-listed Kraft Heinz (KHC) is linked to the CME benchmark through processed cheddar and Kraft Singles. France’s Lactalis is the world’s largest dairy company, but it is privately held and not available on public markets. Two regulated brokers where dairy-processing shares are available:
30-day price history
Chart and daily closing prices
Daily close
30 trading days
| Date | Price (USD) | Price (EUR) | Price (GBP) | Daily change |
|---|---|---|---|---|
| 8 Jul 2026 | US$1.58 | €1.39 | £1.18 | ▼ −1.25% |
| 7 Jul 2026 | US$1.60 | €1.40 | £1.20 | ▲ +1.91% |
| 3 Jul 2026 | US$1.57 | €1.38 | £1.18 | ▲ +0.64% |
| 2 Jul 2026 | US$1.56 | €1.37 | £1.17 | ▼ −1.27% |
| 1 Jul 2026 | US$1.58 | €1.39 | £1.18 | ▼ −1.25% |
| 29 Jun 2026 | US$1.60 | €1.40 | £1.20 | ▲ +3.90% |
| 27 Jun 2026 | US$1.54 | €1.35 | £1.15 | ▼ −1.28% |
| 26 Jun 2026 | US$1.56 | €1.37 | £1.17 | ▲ +0.65% |
| 24 Jun 2026 | US$1.55 | €1.36 | £1.16 | ▼ −0.64% |
| 23 Jun 2026 | US$1.56 | €1.37 | £1.17 | ▼ −1.89% |
| 18 Jun 2026 | US$1.59 | €1.39 | £1.19 | ▲ +0.63% |
| 17 Jun 2026 | US$1.58 | €1.39 | £1.18 | ▼ −1.25% |
| 16 Jun 2026 | US$1.60 | €1.40 | £1.20 | ▼ −0.62% |
| 13 Jun 2026 | US$1.61 | €1.41 | £1.21 | ▼ −0.62% |
| 12 Jun 2026 | US$1.62 | €1.42 | £1.21 | ▲ +1.89% |
| 11 Jun 2026 | US$1.59 | €1.39 | £1.19 | ▼ −1.24% |
| 10 Jun 2026 | US$1.61 | €1.41 | £1.21 | ▼ −0.62% |
| 6 Jun 2026 | US$1.62 | €1.42 | £1.21 | — |