RUBBER Rubber price
Rubber currently trades at US$2.17 per kg (≈ €1.90 · £1.62) — close to the 12-month high. Over the past 12 months it has gained 33.83%, with the annual range running from US$1.61 to US$2.35. In the past 24 hours the price has risen by 1.36%.
Rubber chart
Interactive chart and 30-day overview

The Rubber chart shows how the rubber price has moved over time. The interactive view lets you switch the timeframe (from 7 days up to MAX), the currency (USD / EUR / GBP) and overlay moving averages. Click any two points to measure the percentage change between those dates.
How is rubber priced?
Rubber is priced per kilogram — the standard metric unit for high-value or specialty commodities including industrial gases and rare-earth metals. The kilogram unit reflects retail and small-batch industrial pricing rather than bulk wholesale.
At US$2.17 per kilogram, 100 grams costs US$0.2168 and one tonne US$2,168. Larger industrial buyers typically negotiate volume discounts off the published kilogram benchmark.
What drives the price of natural rubber?
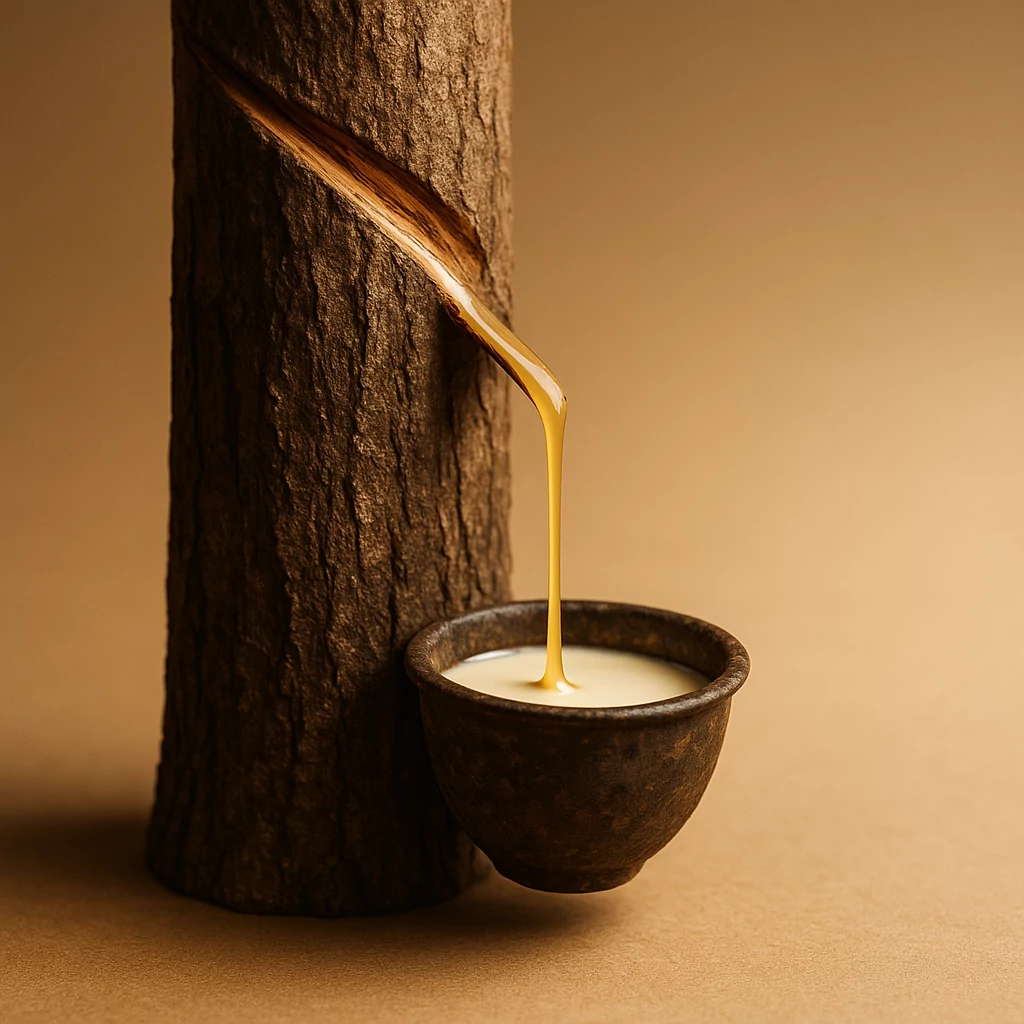
A structural feature of natural rubber supply is its geographical concentration in South-East Asia. The Hevea brasiliensis rubber tree belongs to the equatorial tropics. Commercial latex production needs high and steady rainfall, constant heat and nutrient-rich soil. Thailand, with about 4.7 million tonnes a year, accounts for ~33% of global natural rubber output. Indonesia, with about 3.1 million tonnes a year, adds another ~22%. Vietnam, with about 1.3 million tonnes a year, supplies about ~9%. Together, the three countries produce ~64% of global natural rubber supply. India (~0.85 Mt) and Malaysia produce largely for domestic use, while Côte d’Ivoire (~0.95 Mt and growing quickly) is the emerging African producer. Total global natural rubber output is roughly 14 million tonnes a year, according to the Association of Natural Rubber Producing Countries (ANRPC). This concentration brings risks, including Pestalotiopsis leaf disease, which has caused material yield losses on Indonesian and Thai plantations, and ageing plantations. Many estates still use trees from before the latest generation of cloned varieties.
On the demand side, the main driver is the global tyre industry, which accounts for ~70% of natural rubber use. The market is dominated by four global manufacturers: Bridgestone (Tokyo Stock Exchange ticker: 5108.T), Michelin (Euronext Paris ticker: ML.PA), Continental (Frankfurt ticker: CON.DE) and Goodyear (Nasdaq ticker: GT). Together they represent a large share of the global tyre market. Demand for natural rubber is particularly strong in truck, bus and aircraft tyres. These applications cannot be fully replaced by synthetic rubber because they require higher heat resistance, stronger load-bearing performance and lower wear rates. Passenger-car tyres, by contrast, already contain a significant share of synthetic rubber. Demand is cyclical. Global vehicle sales, commercial fleet traffic and air-traffic volumes have a direct effect on rubber consumption.
The third structural factor is substitution by synthetic rubber. Synthetic rubber, mainly SBR (styrene-butadiene rubber) and BR (polybutadiene rubber), is made from butadiene and styrene, both oil-derived feedstocks. Oil prices therefore have a direct effect on the production cost of synthetic rubber and, through that, on its competitiveness against natural rubber. When Brent and WTI prices are low, synthetic rubber can be produced cheaply, and tyre makers can raise the synthetic share in their blends. This weighs on natural rubber prices. When oil is expensive, natural rubber gains a relative cost advantage, putting sustained upward pressure on TSR20 prices. Most global synthetic rubber capacity is operated by Chinese, Japanese and German petrochemical companies, including Sinopec, JSR and Lanxess. Industry statistics are tracked by the International Rubber Study Group (IRSG).
How to invest in rubber
Holding physical natural rubber is not practical for retail investors. Latex and granulated TSR20 are industrial raw materials that require climate-controlled storage and a B2B logistics chain. A European retail investor can get rubber exposure mainly in three ways: rubber CFDs that track the SGX TSR20 price directly, listed on some platforms under the RUBBER or TSR20 ticker; individual tyre-maker shares such as Bridgestone — 5108.T, Michelin — ML.PA, Continental — CON.DE and Goodyear — GT; and shares in the plantation sector, such as Malaysia’s Sime Darby Plantation, a large integrated rubber and palm-oil plantation group. Two EU-regulated brokers where these instruments are available are:
30-day price history
Chart and daily closing prices
Daily close
30 trading days
| Date | Price (USD) | Price (EUR) | Price (GBP) | Daily change |
|---|---|---|---|---|
| 8 Jul 2026 | US$2.17 | €1.90 | £1.62 | ▲ +1.36% |
| 7 Jul 2026 | US$2.14 | €1.88 | £1.60 | ▲ +1.09% |
| 6 Jul 2026 | US$2.12 | €1.86 | £1.59 | ▲ +1.34% |
| 3 Jul 2026 | US$2.09 | €1.83 | £1.56 | ▼ −0.29% |
| 2 Jul 2026 | US$2.09 | €1.84 | £1.57 | ▼ −2.97% |
| 1 Jul 2026 | US$2.16 | €1.89 | £1.62 | ▲ +1.84% |
| 30 Jun 2026 | US$2.12 | €1.86 | £1.59 | ▲ +1.58% |
| 29 Jun 2026 | US$2.09 | €1.83 | £1.56 | ▼ −1.04% |
| 26 Jun 2026 | US$2.11 | €1.85 | £1.58 | ▼ −6.02% |
| 24 Jun 2026 | US$2.24 | €1.97 | £1.68 | ▼ −1.28% |
| 23 Jun 2026 | US$2.27 | €1.99 | £1.70 | ▲ +0.40% |
| 22 Jun 2026 | US$2.26 | €1.98 | £1.70 | ▼ −0.48% |
| 19 Jun 2026 | US$2.27 | €1.99 | £1.70 | ▼ −0.35% |
| 18 Jun 2026 | US$2.28 | €2.00 | £1.71 | ▼ −1.47% |
| 17 Jun 2026 | US$2.32 | €2.03 | £1.74 | ▲ +1.53% |
| 16 Jun 2026 | US$2.28 | €2.00 | £1.71 | ▲ +1.15% |
| 15 Jun 2026 | US$2.26 | €1.98 | £1.69 | ▲ +0.49% |
| 12 Jun 2026 | US$2.24 | €1.97 | £1.68 | ▲ +0.81% |
| 11 Jun 2026 | US$2.23 | €1.95 | £1.67 | ▼ −1.46% |
| 10 Jun 2026 | US$2.26 | €1.98 | £1.69 | ▼ −1.95% |
| 6 Jun 2026 | US$2.30 | €2.02 | £1.73 | — |