LC Lithium price
Lithium currently trades at US$24,143 per tonne (≈ €21,170 · £18,087) — 18.22% below the 12-month high. Over the past 12 months it has gained 160.68%, with the annual range running from US$9,144 to US$29,522. In the past 24 hours the price has fallen by 0.32%.
Lithium chart
Interactive chart and 30-day overview

The Lithium chart shows how the lithium price has moved over time. The interactive view lets you switch the timeframe (from 7 days up to MAX), the currency (USD / EUR / GBP) and overlay moving averages. Click any two points to measure the percentage change between those dates.
How is lithium priced?
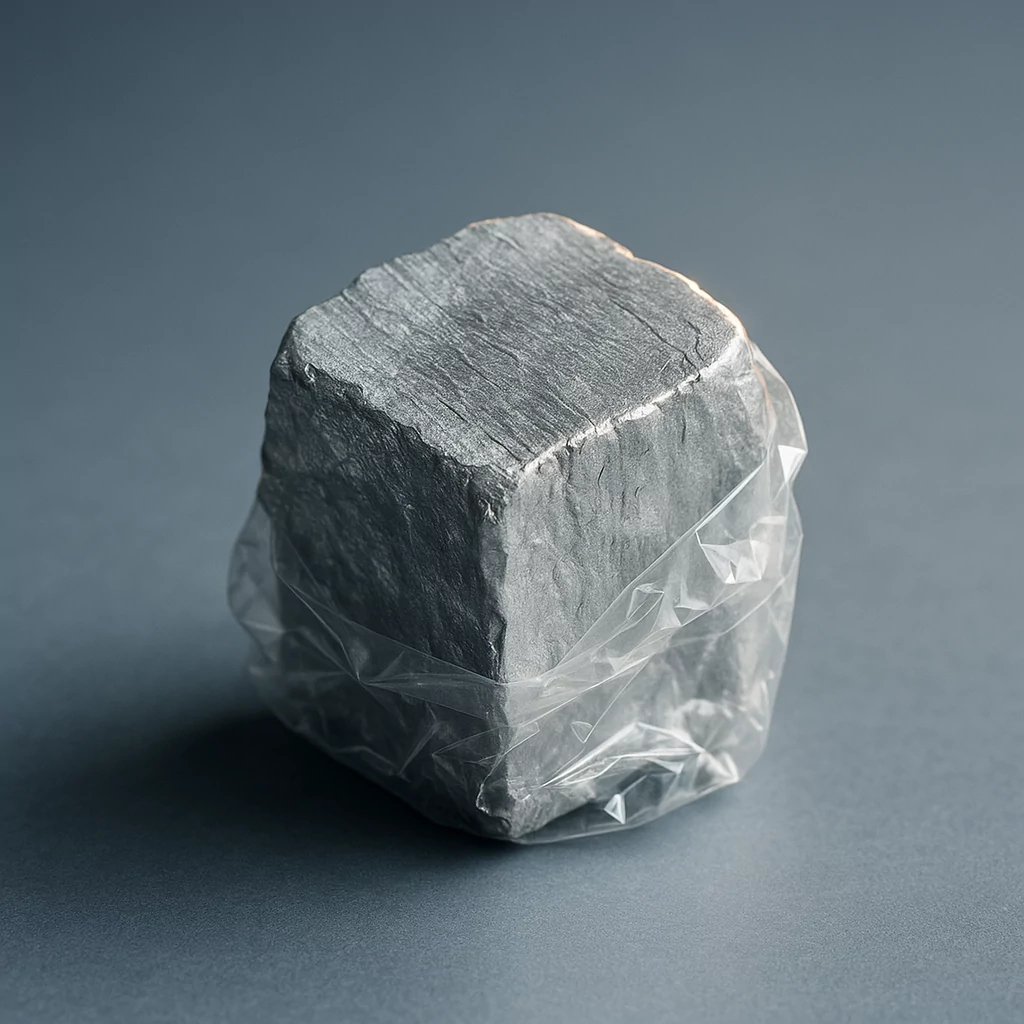
Lithium is priced per metric tonne (1 t = 1,000 kg) — the standard unit for industrial and bulk commodities on the London Metal Exchange (LME), CME and major European exchanges. Wholesale shipments move in containers or bulk vessels, typically in 25-tonne or 100-tonne lots.
At US$24,143 per tonne, one kilogram is worth US$24.14. End-user pricing for processed goods includes refining margins, transport and tariffs on top of the wholesale benchmark.
What drives the lithium price?
Lithium demand depends almost entirely on the pace of the battery industry: about 75% of global lithium consumption goes into batteries for electric vehicles (EVs) and battery energy storage systems (BESS). The rest is split between ceramics, glass, lubricating greases and pharmaceuticals. Monthly EV sales in China, Europe and North America feed directly into prices for battery-grade lithium carbonate and lithium hydroxide. Order cycles at CATL, BYD, LG Energy Solution and Panasonic, as well as European gigafactory projects such as Northvolt, ACC and CATL’s European plants, are major price drivers. Benchmark Mineral Intelligence and BloombergNEF reports point to fast growth in battery-sector demand.
Supply is dominated by three geographic blocs. Australia is the world’s largest producer, with about 85,000 tonnes of lithium content a year, mined from hard rock as spodumene concentrate at sites such as Greenbushes and operations run by Pilbara Minerals and Mineral Resources. This material is typically processed in China into battery-grade compounds. Chile, with about 45,000 tonnes of lithium content a year, and Argentina produce from brine basins in high-altitude salt flats such as the Atacama and Salar de Hombre Muerto. Together with Bolivia, they form the wider “lithium triangle”. Global mine output is about 180,000 tonnes of lithium content a year, according to the USGS Mineral Commodity Summaries. China has a smaller mining role, but about 70% of global lithium-compound processing capacity is in Chinese hands. Most battery-grade Li₂CO₃ and LiOH is produced there.
The medium-term pricing risk is cathode chemistry substitution. Sodium-ion batteries (Na-ion), developed by companies including CATL and BYD, do not use lithium and rely on a cheaper feedstock, sodium carbonate. For now, their energy density is below that of Li-ion technology, so they mainly appear in grid storage and entry-level, short-range electric vehicles. Solid-state batteries, by contrast, may require more lithium. In the short term, prices are moved by Chinese factory inventories, GFEX futures positioning and spodumene auction results. Over longer periods, the cathode mix (LFP vs NMC vs Na-ion) and the expansion of processing capacity matter most.
How to invest in lithium?
Holding physical lithium is not viable for retail investors. The compound is hygroscopic, needs industrial storage, and the market is almost entirely business-to-business. A European retail investor can get indirect lithium exposure mainly through three routes: thematic battery ETFs, including the best-known Global X Lithium & Battery Tech ETF — ticker: LIT and the Amplify Lithium & Battery Technology ETF — BATT; individual lithium mining and processing shares such as Albemarle — ALB, SQM — Sociedad Química y Minera de Chile, Sigma Lithium and Pilbara Minerals — PLS.AX; and stocks across the broader EV value chain, including CATL, BYD and Tesla. Direct lithium CFDs are typically not available. The physical market is OTC in character, and battery-grade Li₂CO₃ trades in an institutional setting. Two regulated brokers with English-language platforms where these ETFs and shares may be available are:
30-day price history
Chart and daily closing prices
Daily close
30 trading days
| Date | Price (USD) | Price (EUR) | Price (GBP) | Daily change |
|---|---|---|---|---|
| 8 Jul 2026 | US$24,143 | €21,170 | £18,087 | ▼ −0.32% |
| 7 Jul 2026 | US$24,221 | €21,239 | £18,146 | ▼ −0.45% |
| 3 Jul 2026 | US$24,332 | €21,336 | £18,228 | ▲ +1.69% |
| 2 Jul 2026 | US$23,927 | €20,981 | £17,925 | ▲ +1.56% |
| 1 Jul 2026 | US$23,559 | €20,658 | £17,649 | ▲ +2.24% |
| 30 Jun 2026 | US$23,043 | €20,206 | £17,263 | ▲ +3.13% |
| 29 Jun 2026 | US$22,344 | €19,593 | £16,739 | ▼ −0.49% |
| 26 Jun 2026 | US$22,454 | €19,690 | £16,822 | ▼ −2.87% |
| 25 Jun 2026 | US$23,117 | €20,271 | £17,318 | ▼ −0.32% |
| 24 Jun 2026 | US$23,190 | €20,335 | £17,374 | ▼ −0.63% |
| 23 Jun 2026 | US$23,338 | €20,465 | £17,484 | ▲ +0.96% |
| 22 Jun 2026 | US$23,117 | €20,271 | £17,318 | ▼ −6.13% |
| 18 Jun 2026 | US$24,626 | €21,594 | £18,449 | ▼ −1.33% |
| 17 Jun 2026 | US$24,957 | €21,885 | £18,697 | ▲ +0.30% |
| 16 Jun 2026 | US$24,884 | €21,820 | £18,642 | ▼ −0.88% |
| 12 Jun 2026 | US$25,105 | €22,014 | £18,808 | ▲ +2.40% |
| 11 Jun 2026 | US$24,516 | €21,497 | £18,366 | ▲ +0.45% |
| 10 Jun 2026 | US$24,405 | €21,401 | £18,284 | ▲ +1.69% |
| 6 Jun 2026 | US$24,000 | €21,046 | £17,980 | — |