Bill Williams described both the Awesome Oscillator and the Accelerator Oscillator. On a chart both appear as a row of green and red bars below price. The first measures momentum, the second measures its acceleration.
What the Awesome Oscillator measures
The Awesome Oscillator compares a short-term move with a longer one. It is not calculated from closing prices but from the median price of the candle, the average of the high and the low.
Both numbers, 5 and 34, are Fibonacci numbers. When AO is above zero, the five-period average sits above the thirty-four-period one. On a daily chart that means price over the past week is averaging higher than over roughly the last seven weeks. Below zero the opposite holds.
The value on its own says nothing, because it is not normalized. The reading on gold falls in a different range from the reading on a currency pair. You read the shape, and which side of zero the bars are on, not the number.
Green and red do not mean bullish and bearish
This is the most common misreading of both indicators. The color is not set by zero but by the previous bar. A bar is green when it is higher than the one before it, and red when it is lower.
So a green bar deep below zero does not mark a bull market. It means the decline has slowed. Likewise, a red bar high above zero still belongs to an advance, just one that is losing pace.
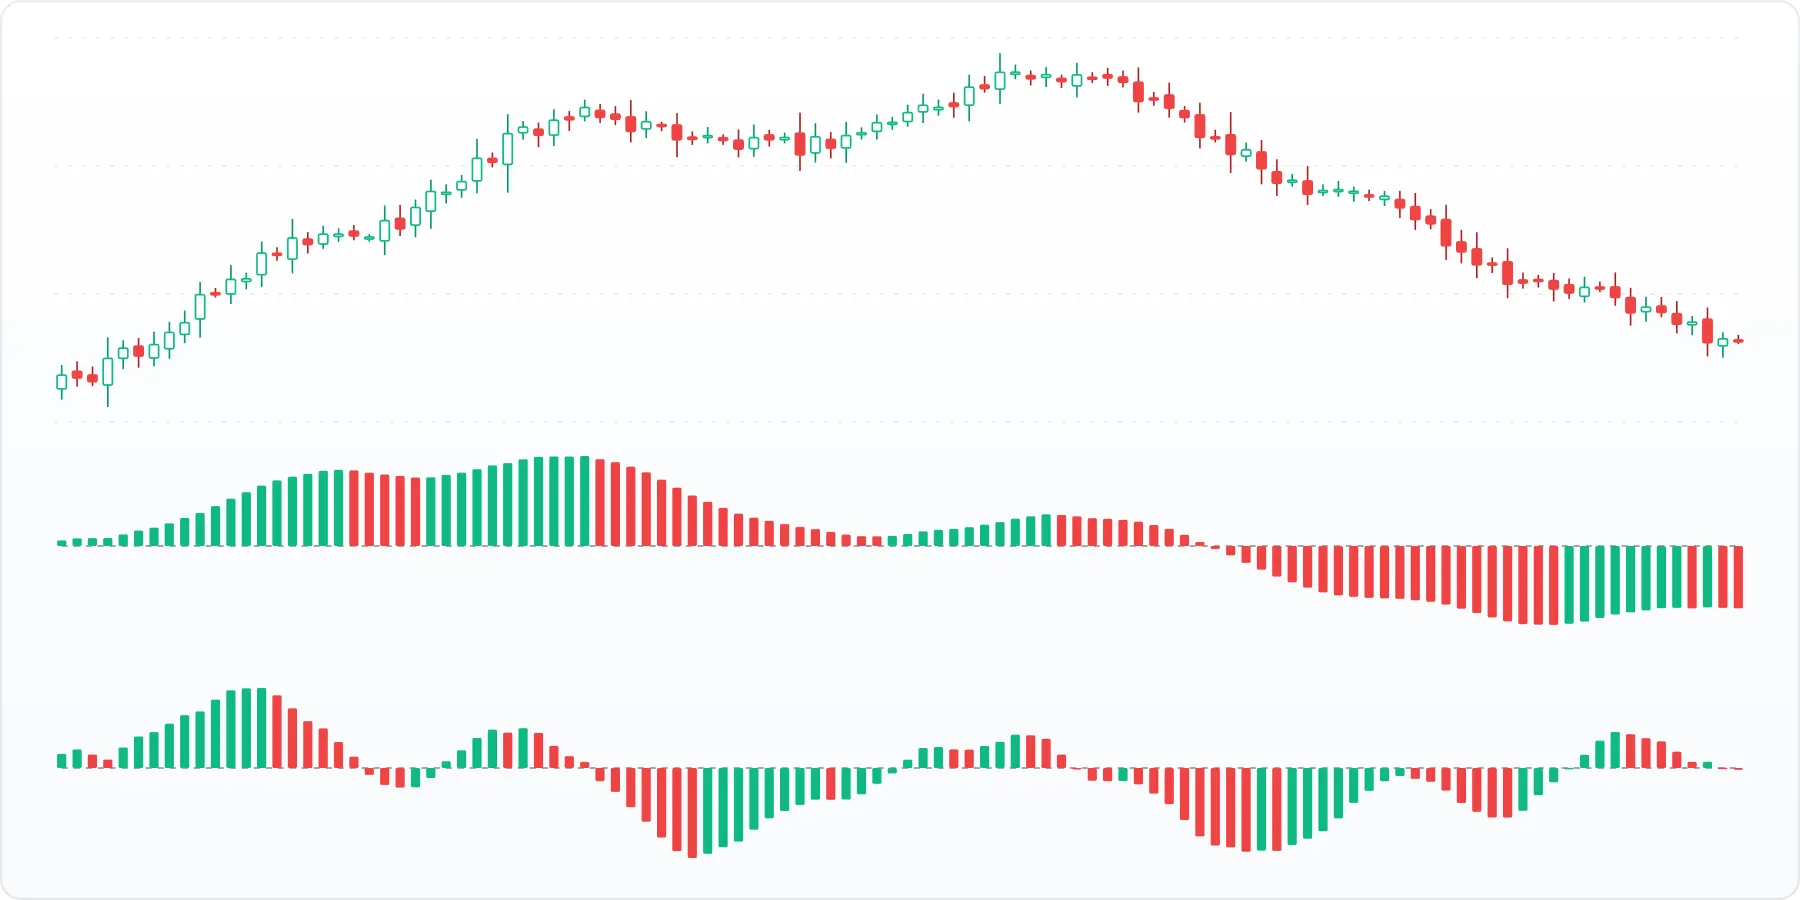
Price on top, AO in the middle, AC at the bottom. Notice that AC drops below zero while AO is still well above it.
The Accelerator Oscillator measures acceleration
The Accelerator takes the Awesome Oscillator one step further.
Momentum is speed. Acceleration is the change in that speed. A car doing 130 km/h that eases off the gas is still moving fast, but it is already slowing down. AO would be high, AC already below zero.
Three Awesome Oscillator signals
Williams described three patterns for AO. All of them are read from the bars, not from the level.
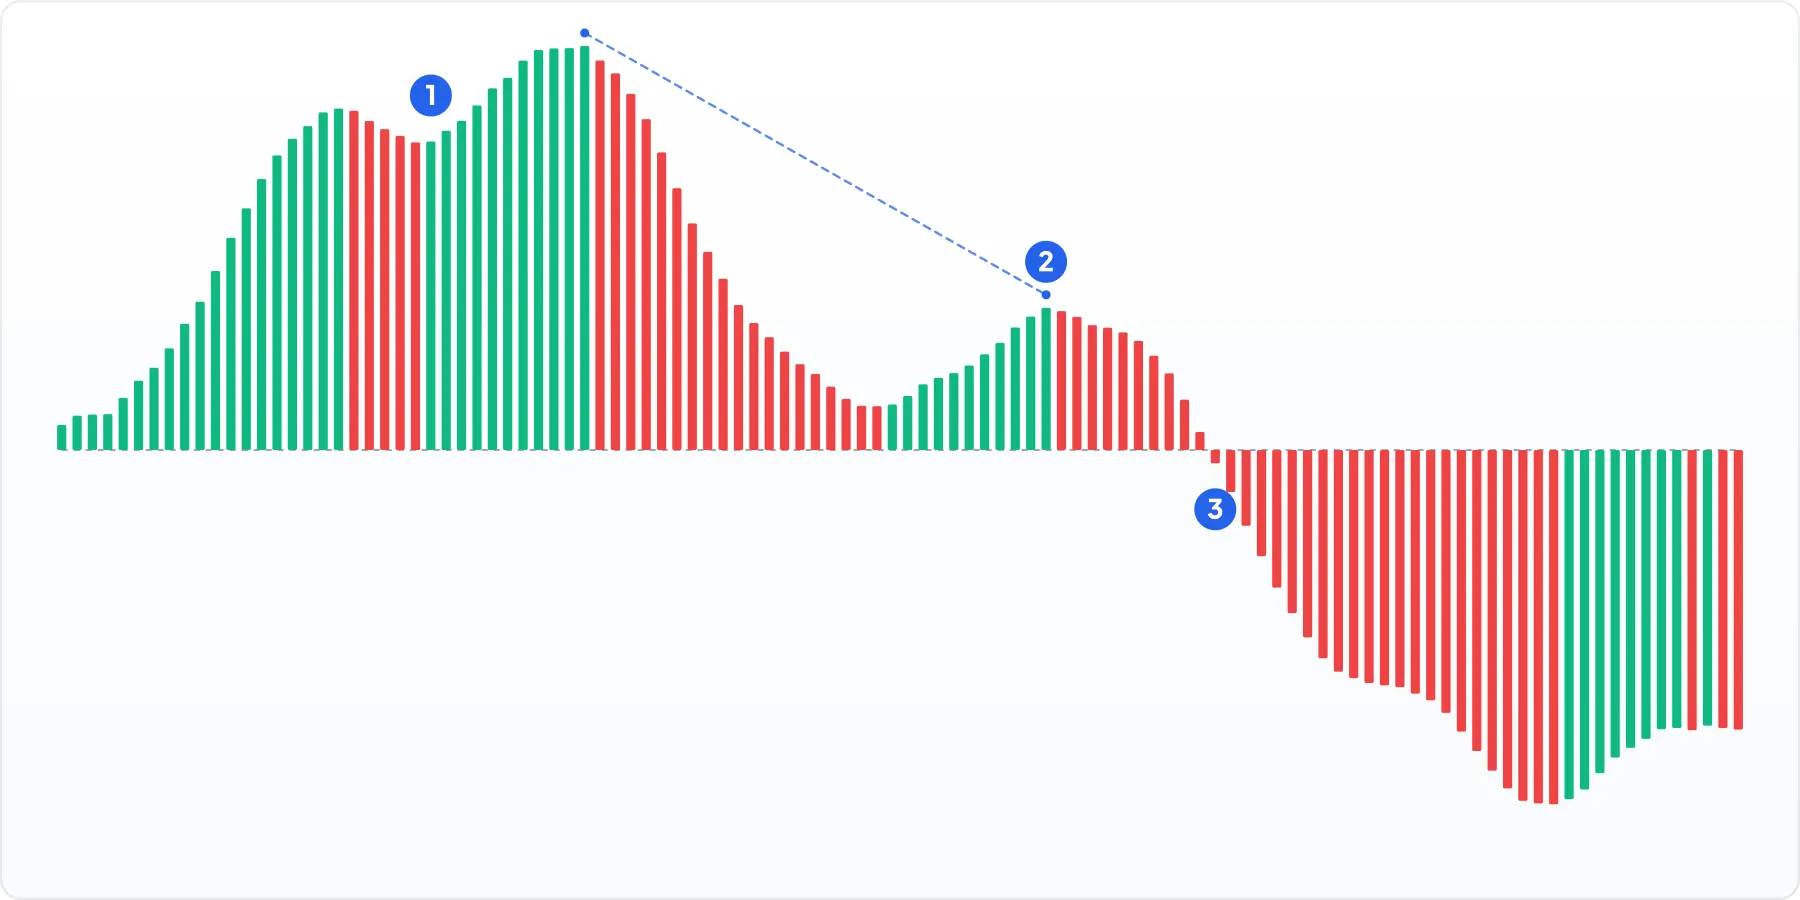
All three on a single stretch. The saucer (1), twin peaks with a lower second peak (2) and the zero line cross (3).
How many bars the Accelerator Oscillator needs
With AC it comes down to whether you are trading with momentum or against it. Against it, Williams wants one extra bar as confirmation.
| I want to | AC sits | What I need |
|---|---|---|
| buy | above zero | two green bars |
| buy | below zero | three green bars |
| sell | below zero | two red bars |
| sell | above zero | three red bars |
With AC, unlike AO, you do not wait for a zero-line cross. Zero does not generate the signal here. It only decides how many bars you need.
Where both indicators fail
AO needs 34 candles of history and AC another five on top of that. On a market that has only just started trading, or right after a weekend gap, the first forty candles or so show nothing.
The bigger problem is a market with no direction. Both indicators are a difference of moving averages, so in a sideways market they hug zero and zero-line crosses pile up. Signals from a stretch like that carry no information.
The “leading indicator” label often attached to AC only means it turns earlier than AO, not that it forecasts price.
Moving averages, which both indicators are built from, are covered in more detail in a separate article on the moving average.