
W. D. Gann (1878–1955) developed a number of his own methods for analysing price charts. He paid the most attention to geometric angles, which in his view describe the relationship between time and price. He believed they could predict the next price move.
Three tools came out of that work and are still in trading platforms today: the Gann line, the Gann fan and the Gann grid. All three rest on the 1×1 ratio, and all three share the same limitation: their slope is set by the chart scale, which the user chooses, not the market.
What Gann was actually drawing
Gann started from the idea that time and price are in perfect balance when price rises or falls at an angle of 45 degrees to the time axis. This angle is labelled 1×1 and corresponds to a move of one unit of price for every unit of time.
The notation 1×1 is therefore a ratio, not a geometric figure. That it looks like 45 degrees is a property of the chart — it holds only when the X axis and the Y axis have the same scale. The MetaTrader help file says so explicitly: for the ratio of price increase to time to match the angles in degrees, both axes must have the same scale.
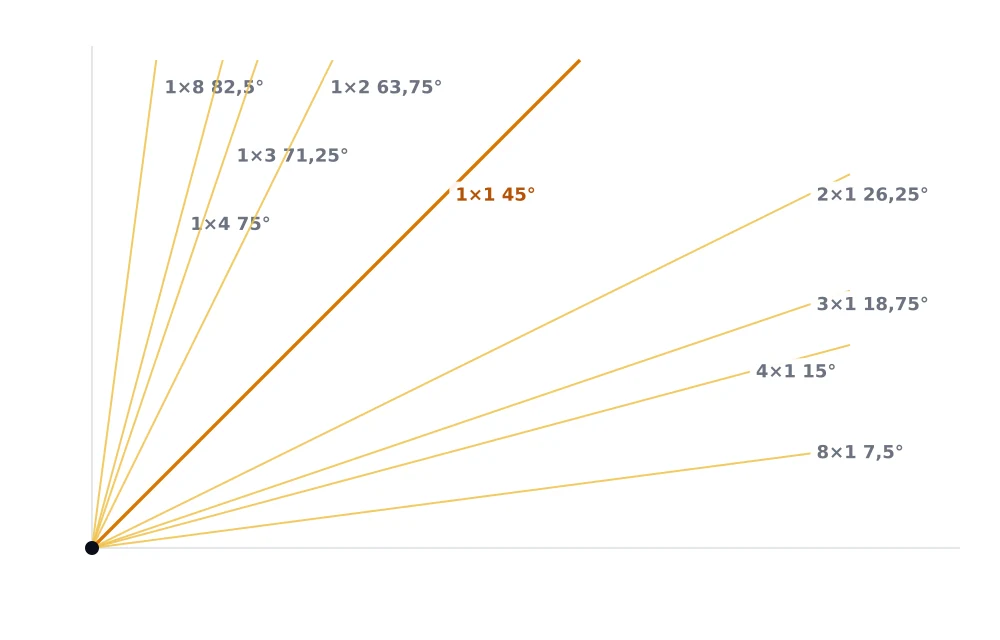 The nine basic rays as listed in trading platform help files. The most important one is 1×1.
The nine angles and what is odd about them
Gann emphasised the following nine angles, and considered 1×1 the most important of all:
| Ratio | Angle | Ratio | Angle |
|---|---|---|---|
| 1×8 | 82.5° | 2×1 | 26.25° |
| 1×4 | 75° | 3×1 | 18.75° |
| 1×3 | 71.25° | 4×1 | 15° |
| 1×2 | 63.75° | 8×1 | 7.5° |
| 1×1 | 45° |
The only exact figure in the table is 45 degrees. The 1×2 ratio means two units of price per one of time, that is a slope of 2 — and the arctangent of two is 63.43°, not 63.75°. At the 1×4 ratio the difference is almost a full degree: the true value is 75.96°, the table gives 75°.
The deviation follows a rule: all nine values are true arctangents rounded to the nearest multiple of 3.75 degrees, which is ninety degrees divided by twenty-four. That is why the table is perfectly symmetrical — 82.5 + 7.5, 75 + 15 and 63.75 + 26.25 all give ninety. Why it was done this way cannot be documented from Gann’s own text. It is a reconstruction after the fact by Gann authors.
One more trap: the labels 1×2 and 2×1 are swapped between sources. The MetaTrader 5 help file assigns 63.75° to the 1×2 ratio, while MetaQuotes’ own article on the MQL5 portal assigns the same angle to the 2×1 ratio. Go by whether the ray is steep or flat, not by its name.
The Gann line
The Gann line is a segment drawn at an angle of 45 degrees, that is the 1×1 — one change in price per one unit of time. Two points are enough to construct it.
Under Gann’s concept a line at this slope is a long-term trend line, rising or falling. As long as prices stay above a rising line, the market holds its bullish direction. Below a falling line the market is bearish. A break of the line usually signals a reversal of the main trend. When prices fall to this line during a rising trend, time and price are, according to Gann, in full balance.
The Gann fan
Fan lines are constructed at various angles from a significant low or high on the price chart. Here too Gann regarded the 1×1 ray as the most important, but any of the nine can act as support or resistance depending on which way the market is going.
If prices drop below the 1×1 line, according to Gann it means a trend reversal, and prices should then fall to the next ray in order, in this case 2×1.
The Gann grid
The grid is the last of the three, and it differs from the line in that it does not draw a single segment but a whole network of parallel 1×1 lines in both directions. The result is a regular diamond mesh across the entire chart, whose intersections are meant, under Gann’s concept, to serve as support and resistance levels.
Construction takes two points that set the cell size — and with it the whole geometry. The same applies here as to the line and the fan, only multiplied: the cell size is a choice, not a property of the market.
The angles hold only on a calibrated chart
The slope of a line on the screen depends on how much price there is per bar. That is set by the user.
In MetaTrader this is what the Pips Per Bar parameter does, the number of pips per bar. Until you set it, the declared 45 degrees has no relation to the data. In TradingView the price-to-bar ratio is locked with the Lock price to bar ratio option, which is optional and switched off by default.
The consequence is awkward: two people who open the same chart with different scale settings get different levels and different signals out of the same tool. Gann left no rule for how the scale should be chosen.
What we know about reliability
The short answer: almost nothing.
Gann angles are not among the rules tested in academic surveys of the profitability of technical analysis — the reference survey by Park and Irwin of the University of Illinois went through 92 modern studies, and moving averages, channel breakouts or filter rules are in there, Gann angles are not. That is no accident: a method where the user picks the scale and the starting point cannot be written down as an unambiguous rule, and what cannot be written down can be neither tested nor refuted. David Aronson builds a whole book on this distinction, Evidence-Based Technical Analysis.
The origin of the method belongs here too, and articles about Gann usually leave it out. Gann derived his forecasts partly from astrology: in material prepared for a student in March 1954 he draws an outlook for the coffee market from planetary aspects. And in the preface to his 1927 novel he admits himself that he encoded the method deliberately.
Does that make Gann’s tools useless? As a forecast, yes. As an aid for drawing trend lines from a significant low or high, they serve as well as any other hand-drawn line.
The angle figures follow the MetaTrader 5 platform help file, the arctangent calculations are our own. Verified as of August 2026.