The moving average (MA) is a widely used indicator and finds plenty of applications in technical analysis, where it helps determine the direction of a trend. It is a trend-following or lagging indicator, because it is built from past prices.
A moving average is simply a way to gauge whether a market is heading up or down. The most common use of moving averages is to identify the direction of the trend and to look for levels of support and resistance (mainly on forex, commodities, stocks and indices).
What a moving average is
We can probably agree that most people are not fond of math. School teaches plenty of complicated things that rarely find any use in real life. Some of them, though, genuinely help.
The moving average is one of those. Thanks to computers, plotting it takes a few seconds. Behind that simple step sits the arithmetic mean of a series of numbers. Nothing difficult about it, but who has time to do that by hand?
- A moving average is the average price, or some other data value, plotted over time.
- It is called moving because it is recalculated at every successive point in time. Moving averages are used in technical analysis and the result is a line that smooths out the swings in the price of the asset being measured.
As an example, take one of the most commonly used moving average settings: the number 100.
- In a given timeframe it means the last 100 records (candles) enter the calculation and an average value is worked out from them.
- When the last candle closes and a new one opens, the first candle in the series drops out and a new average is calculated.
- This repeats over and over, and the calculated averages are displayed as the curve we see on the screen.
Types of moving averages
The two basic and commonly used moving averages are the simple moving average (marked SMA in platforms), which takes every price in its window with the same weight, and the exponential moving average (EMA), which gives more weight to recent prices.
Simple vs exponential moving average
- These are the two basic calculation methods. In the simple moving average all values enter with the same weight. In the exponential one the last candles in the row carry more weight.
- In practice this means that when direction changes sharply, the exponential moving average reacts sooner. How fast that reaction is depends on the period we plot it for. The higher the period, the greater the lag.
- Which brings us to the biggest disadvantage of moving averages, and of other indicators too. Their use is complicated by their lag. The way you work with them has to allow for that. They do not tell us a new trend is starting. They only confirm that it already has…
Simple moving average (SMA)
The average of the last n values in a time series. A ten-day moving average is the average closing price over the last ten days. The larger n is, the stronger the smoothing and the further the line sits from the original data.
Every price in the window carries a weight of 1/n — on a ten-day SMA that is ten percent, whether it is yesterday’s price or a price ten days old. Prices outside the window carry a weight of zero. From that comes the property known as the drop-off effect. Each time the window shifts, the oldest value falls out and the average moves, even if today’s price has not changed at all.
Weighted moving average (WMA)
The weights fall linearly. The newest price carries a weight of n, the one before it n −1, and so on down to the oldest with a weight of 1. The sum is then divided by the triangular number n(n+1)/2 — on a five-day average that is 5 + 4 + 3 + 2 + 1 = 15.
For a five-day WMA the weights work out at 33.3%, 26.7%, 20.0%, 13.3% and 6.7%. It therefore responds to fresh movement better than an SMA. That linear decline is also the difference from an EMA, where the weights fall geometrically.
Exponential moving average (EMA)
The weights fall geometrically and the calculation is recursive, from the previous value:
EMA = α × price + (1 − α) × previous EMA
The coefficient α is derived from the period by the relation α = 2 / (n + 1). A ten-day EMA therefore has α ≈ 0.18.
An older notation uses a percentage instead of a period. A “ten percent EMA” means α = 0.10, which corresponds to a nineteen-day period, and every older day carries ninety percent of the weight of the day one step newer: 10%, 9%, 8.1%, 7.3% and so on. The weights never drop exactly to zero — an EMA has infinite memory and the last n periods carry roughly 86.5% of the total weight in it. That is why EMA values at the start of a series differ between platforms, depending on how each one seeded the calculation.
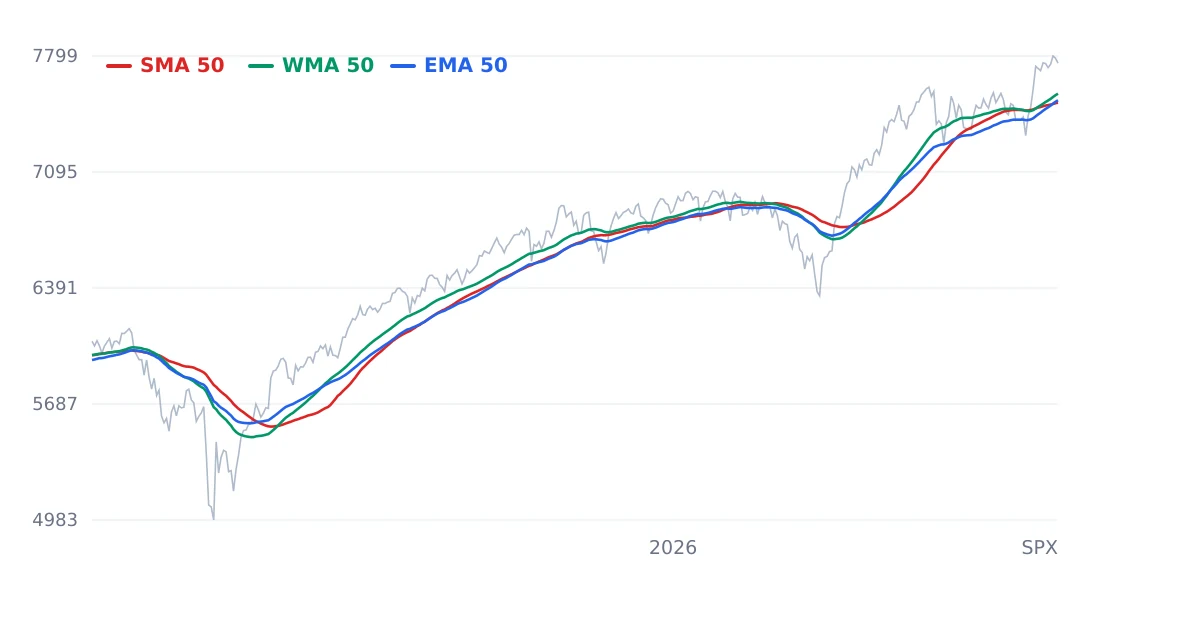
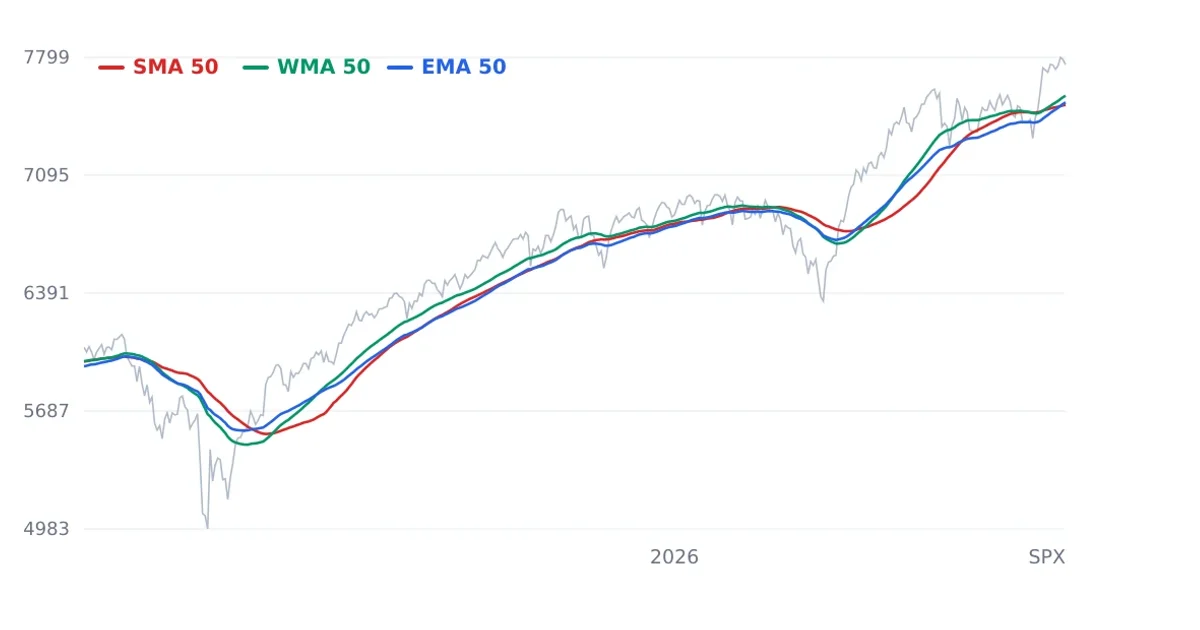
Three moving averages with the same period on the same price. The WMA hugs the price most closely, the SMA stays furthest away, the EMA sits between them. Data: Yahoo Finance.
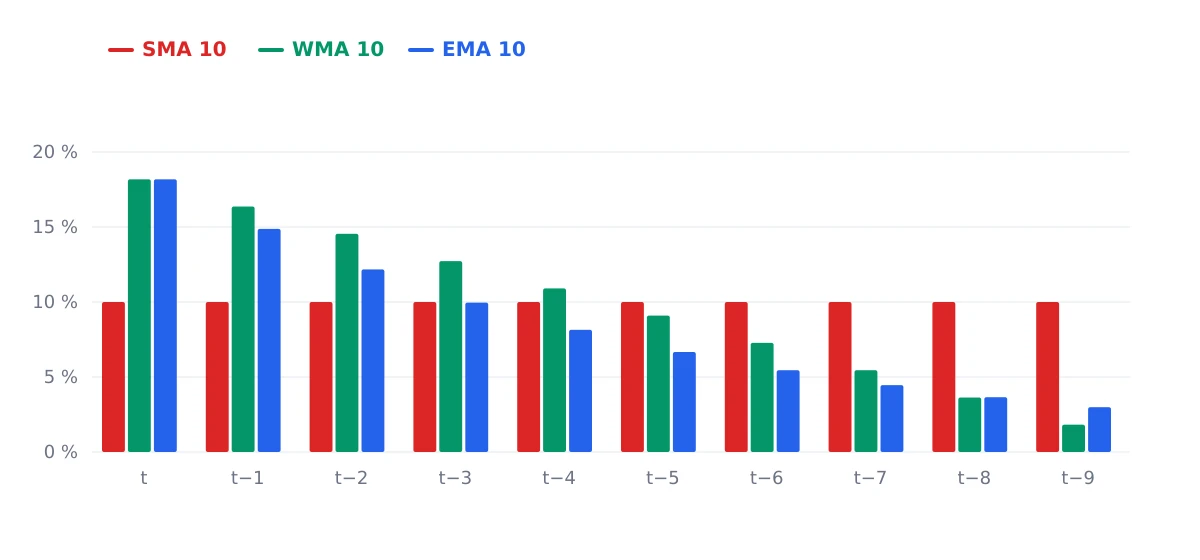
How the three averages split the weight across the last ten prices. The SMA gives each of them the same ten percent, the WMA falls linearly, the EMA geometrically. With the EMA the last ten periods carry only 86.5% of the weight, the rest stays in older data.
How much lag a moving average has
Lag is not a matter of feel, it can be calculated as the centre of gravity of the weights, meaning the average age of the data the average is built from:
- SMA(n): (n − 1) / 2 periods
- WMA(n): (n − 1) / 3 periods
- EMA(α): (1 − α) / α periods
One clarification is needed here, because this gets mixed up almost everywhere. Substituting the standard α = 2/(n+1) gives an EMA exactly (n − 1) / 2 — the same lag as an SMA of the same length. A two-hundred-day SMA and a two-hundred-day EMA both have their centre of gravity 99.5 days in the past.
So why does an EMA look faster? Because it gives the last day a weight of 2/(n+1) against 1/n on an SMA, roughly double, and it has no drop-off effect. It therefore reacts more strongly to a price jump at first. Lower lag at the same length comes only from the WMA with its third.
74% of retail investor accounts lose money when trading CFDs with this provider. You should consider whether you understand how CFDs work and whether you can afford to take the high risk of losing your money.
How moving averages are used
As already noted, a moving average serves above all to identify the direction of the trend in the asset being followed.
Moving averages lag behind the current price of the asset, because they are based on past prices. The longer the period of the moving average, the greater the lag. So a 200-day moving average will lag far more than a 20-day moving average, because it contains the asset’s prices over the last 200 days.
Which of the (20 - 50 - 200) day moving averages you use depends mainly on the trading goals of the individual trader. Shorter moving averages are used for short-term trading and the longer ones mainly by longer-term investors who hold their chosen assets (hodl, as they call it) and do not trade on a daily basis.
The 50-day and 200-day averages are the ones traders and investors watch most, and price breaking above or below them is taken as a trading signal. The fifty-day crossing above the two-hundred-day is called a golden cross, the opposite crossing is a death cross. We break them down in detail in the article on the golden cross.
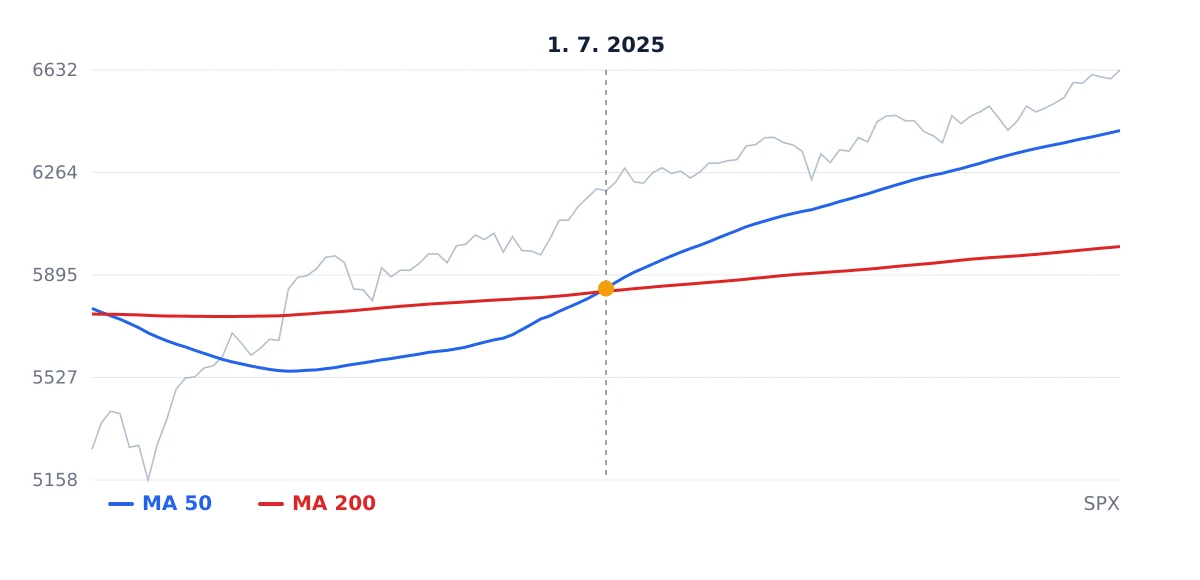
A close look at the golden cross on the S&P 500 from July 1, 2025. The fifty-day average crosses the two-hundred-day only once the price has already been rising for several months. That is exactly what the lag looks like in practice. Data: Yahoo Finance.
It pays to look at their reliability soberly, though. Brock, Lakonishok and LeBaron published a study in the Journal of Finance in 1992 in which rules based on moving averages worked on the Dow Jones index over the years 1897 to 1986. Sullivan, Timmermann and White then expanded the tested set to 7,846 rules in 1999 and used a statistical test that accounts for how many rules were searched through. Out of sample, in the years 1987 to 1996, the best rule from the original study returned 8.63% a year with a p-value of 0.154 — a result indistinguishable from chance.
The number 200 is not optimised either, it is a convention. Faber notes in his own study that averages from three to twelve months worked much the same, so the exact length does not matter that much.
Do not forget that moving averages are only one of many indicators that help us gauge where our underlying asset heads next, and that depends on many other factors.
The moving average inside other indicators
Anyone who understands the moving average also understands most of the indicators they know under a different name:
- MACD is the difference between a twelve-day and a twenty-six-day EMA, with a nine-day EMA added as the signal line. It is therefore a measure of the distance between two moving averages.
- Bollinger Bands are a twenty-day moving average plus or minus two standard deviations.
- RSI works out the ratio of the average gain to the average loss, both smoothed.
- ATR is a smoothed average of the true range and is used to set stop-losses and position size.
The smoothing in RSI and ATR has one quirk. Wilder uses a coefficient of α = 1/n in it, which corresponds to an EMA with a period of 2n − 1. A fourteen-day RSI therefore works internally with a twenty-seven-day EMA, not a fourteen-day one as is often written.
Trading strategies
There is an enormous number of strategies based on moving averages. Whether it is crossovers of two or more moving averages with different settings, crossovers with the price line or an entirely different use. Always bear in mind that a moving average is “only” a function of price and time, which is why it tells us nothing beyond what the chart itself does.
Understood and used properly, though, it can make our day-to-day trading simpler and easier to read.