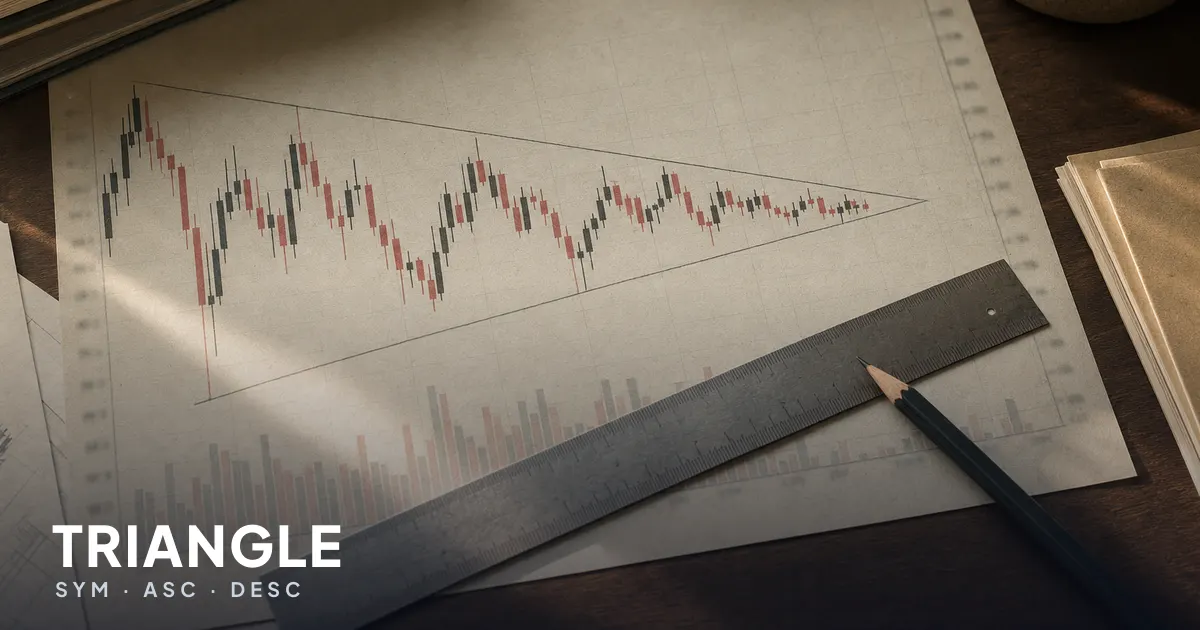
A triangle is a shape that appears on a chart when the price range gradually narrows. Highs and lows converge towards a common point and the market pauses for a while between two boundaries before it breaks through one of them.
How a triangle forms
The market moves in waves between supply and demand. When the gap between them narrows, each wave is shorter than the one before. Highs fall, lows rise, or only one of those two series moves. The line through the highs and the line through the lows then converge and form the shape of a triangle.
Three variants are distinguished by how those two boundaries behave.
| pattern | upper boundary | lower boundary |
|---|---|---|
| symmetrical | falls | rises |
| ascending | horizontal | rises |
| descending | falls | horizontal |
The boundaries of a triangle are ordinary support and resistance levels, only sloping. The same rules apply to them. The more times price touches them without breaking through, the more significant they are for the market.
Symmetrical triangle
The most common of the three. The upper boundary connects falling highs, the lower one rising lows, and both converge at roughly the same rate.
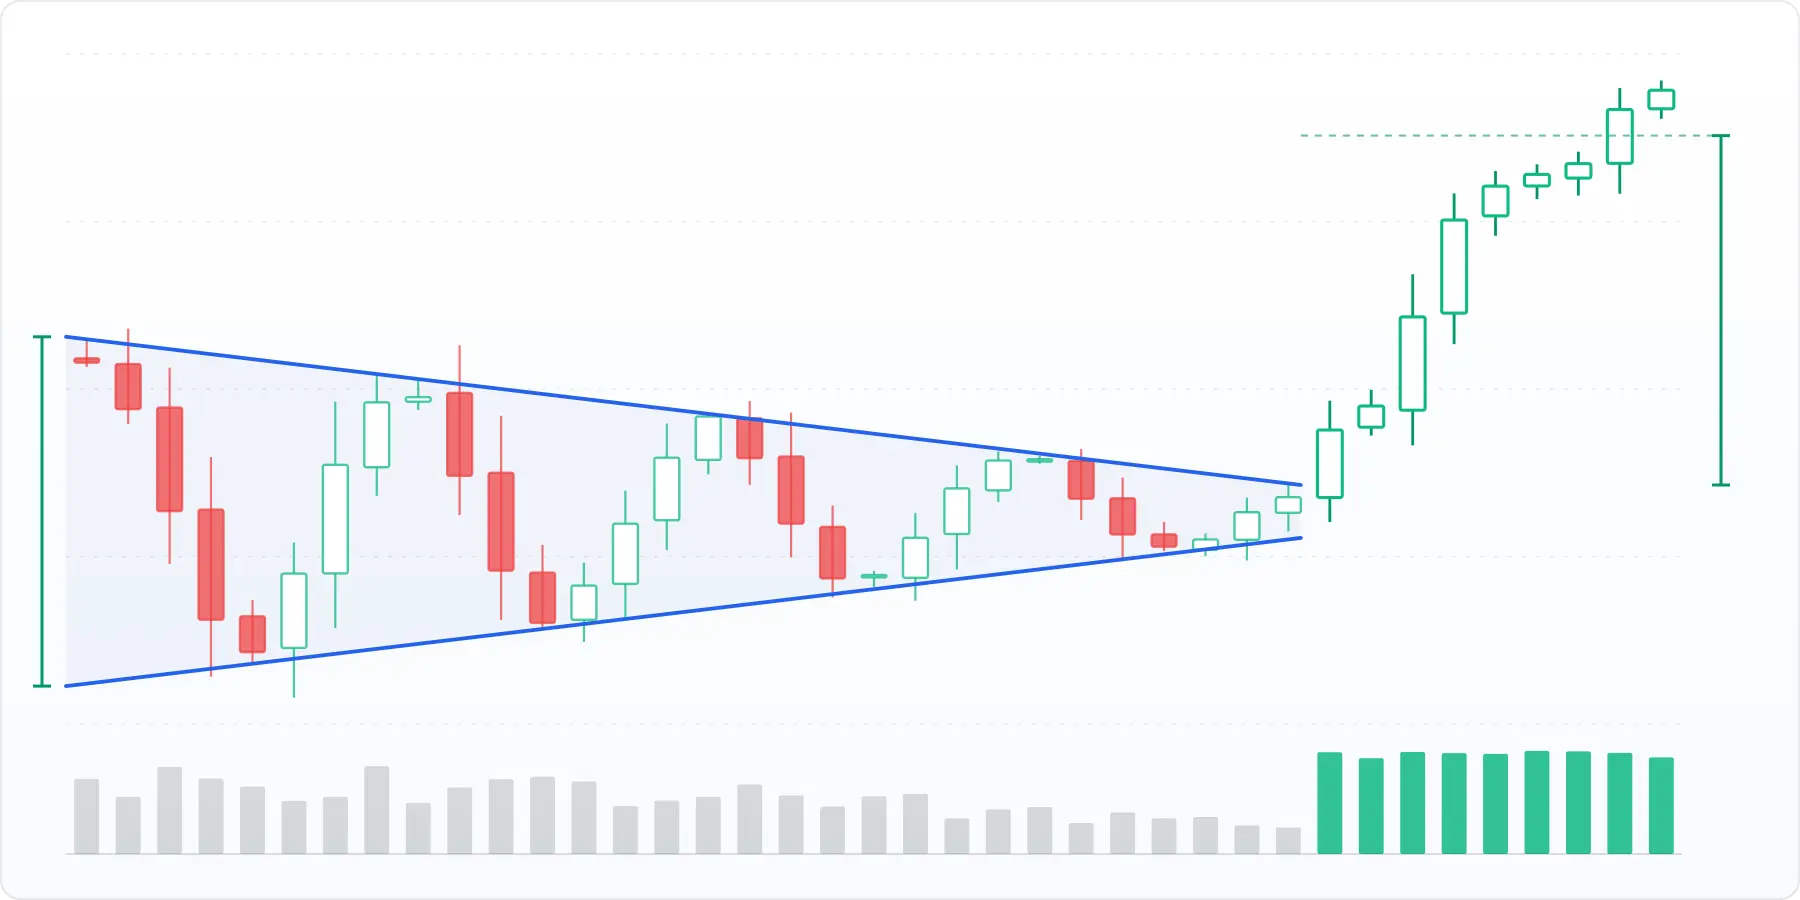
Symmetrical triangle. On the left is the marked height of the base, on the right the same distance projected from the breakout point. The bars at the bottom are volume.
It expresses indecision, when neither side has the upper hand. That is why traders wait for the breakout, and only that is a readable signal.
In practice there are two approaches to it. Some trade it only in the direction of the trend that preceded the pattern, so a breakout upwards in a rising market and downwards in a falling one. Others take both sides regardless of the preceding trend. Filtering by the preceding trend removes part of the false breakouts, but misses moves that go against it.
Ascending triangle
The upper boundary is horizontal, that is a series of highs at roughly the same level. The lower boundary rises, because each successive low is higher than the previous one.
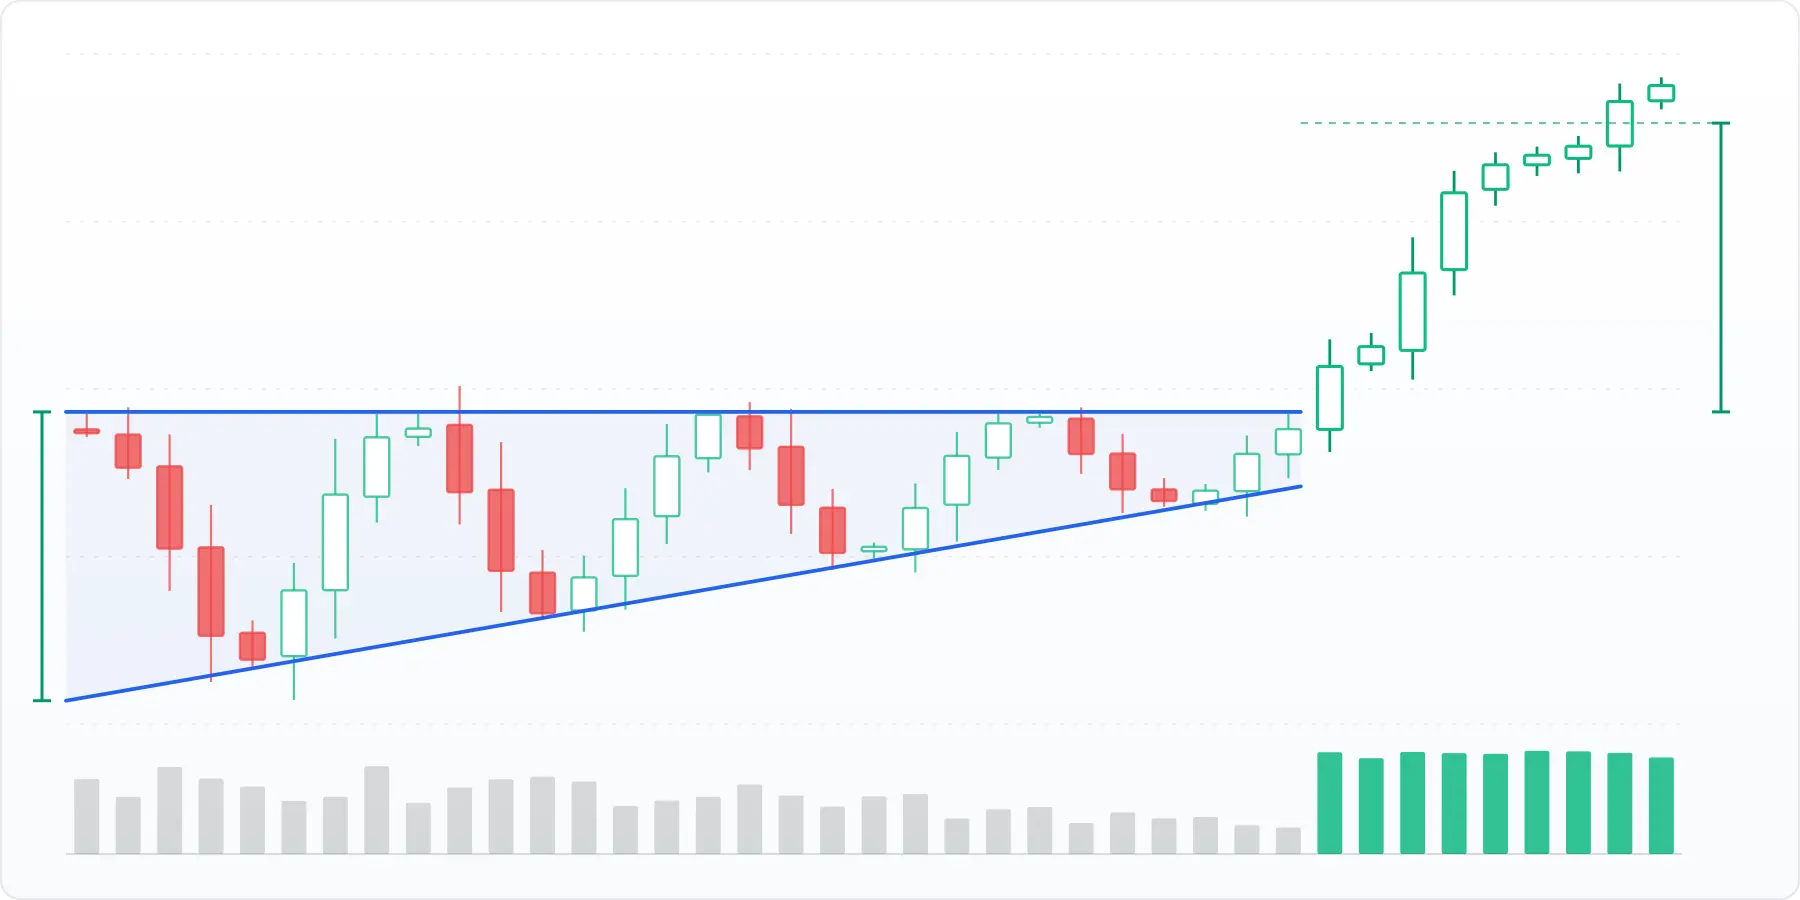
Ascending triangle. Buyers are willing to pay more each time, while sellers hold the same price level.
That horizontal boundary at the top is a level where enough sell orders sit to stop price every time. Rising lows mean that buyers are willing to pay more and more. When the sell orders at that level run out, price gets through it.
The pattern appears in a rising as well as a falling market. In a rising one it confirms continuation, in a falling one it can foreshadow a reversal.
Descending triangle
The mirror case. The lower boundary is horizontal, that is a series of lows at the same level, and the upper boundary falls, because each successive high is lower.
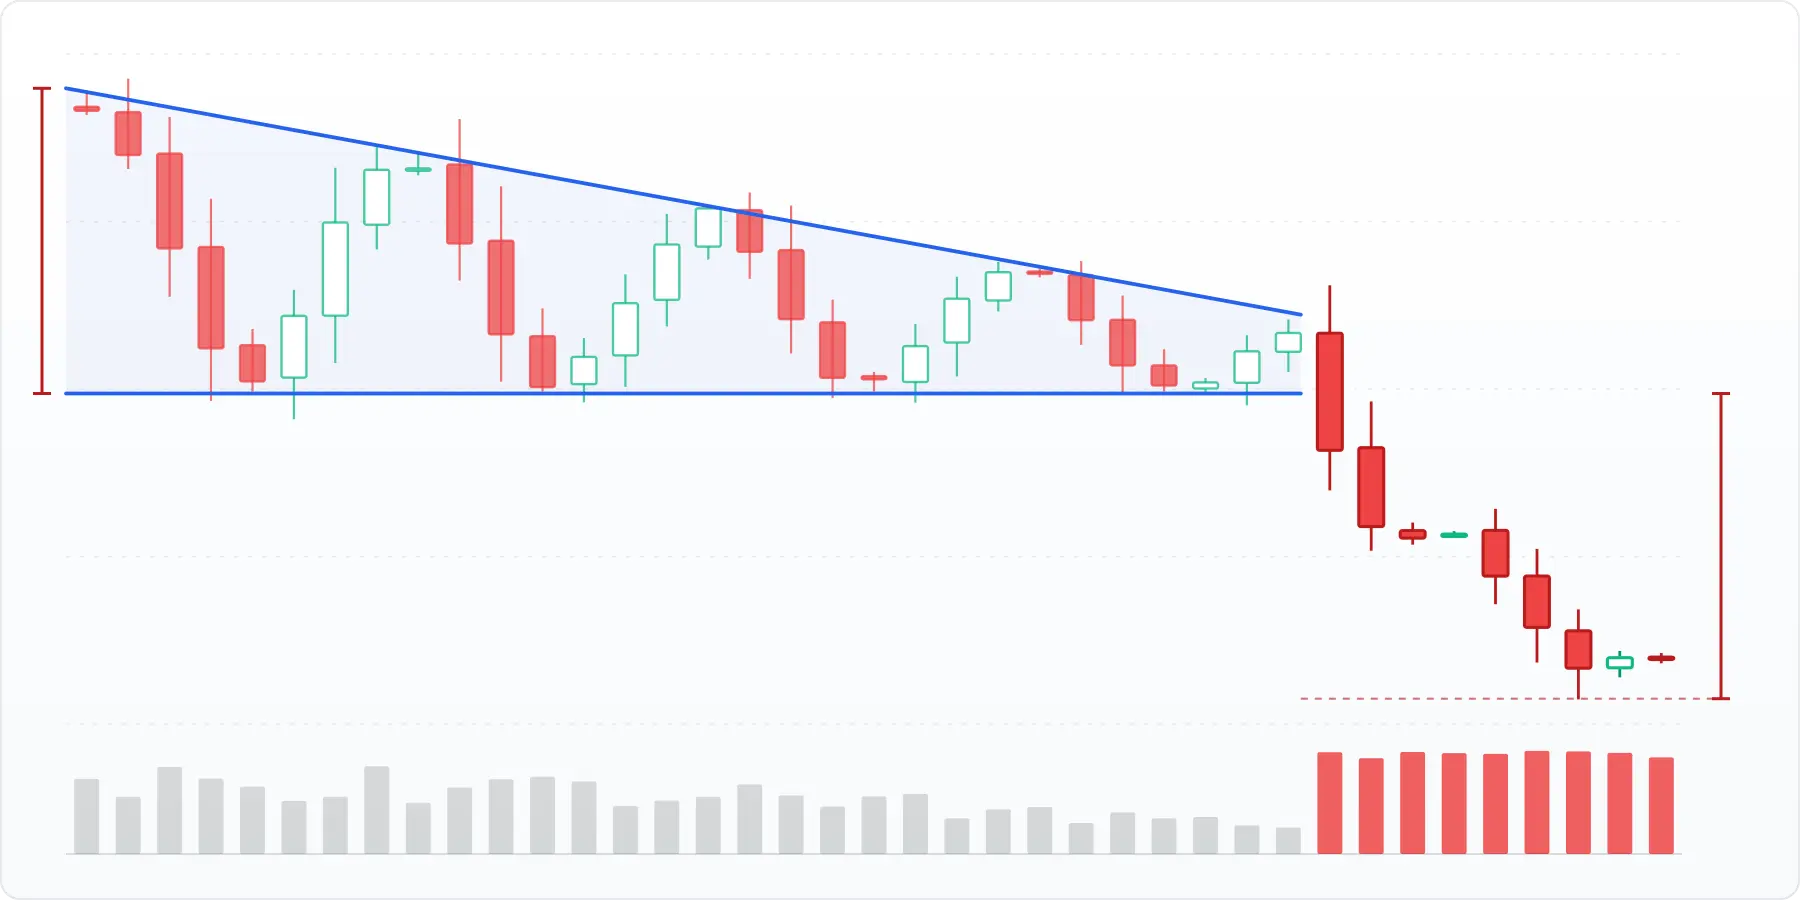
Descending triangle. Sellers settle for a lower and lower price, while buyers hold one level.
At the horizontal level below sit buy orders that lift price repeatedly, but sellers settle for a lower price each time. When buying interest at that level dries up, price drops below it.
Like the ascending one, it appears in both trends. In a falling one it confirms continuation, in a rising one it can be a reversal.
What volume says
Volume usually falls during the pattern. The range narrows, traders wait and activity dries up. On the charts above these are the grey bars that get gradually shorter.
On the breakout it should turn around. A rise in volume shows that real interest stands behind the move, not just a momentary swing in a thin market. A breakout that comes without volume returns back into the pattern more often.
How far the move can reach
The usual target estimate comes from the height of the triangle. Measure the vertical distance between the boundaries at the widest point, that is at the start of the pattern, and project the same distance from the point where price broke through the boundary.
On all three charts this is the pair of vertical brackets.
It is a rough estimate, not a forecast, because it says only what kind of move would match the size of the preceding consolidation.
Where it breaks down
You recognise a triangle reliably only in hindsight. While the pattern is still forming, the boundaries are just two lines fitted through a few points and they can shift with every further move.
False breakouts are common. Price breaks through the boundary, takes out the orders on the other side and comes back. That is exactly why volume is watched and why part of traders wait for confirmation instead of entering on the first touch.
The closer to the apex, the weaker the signal. A breakout that comes as late as the last quarter of the triangle, when the boundaries almost touch, tends to be less reliable than a breakout earlier on.
Bull and bear flags are read in a similar way.