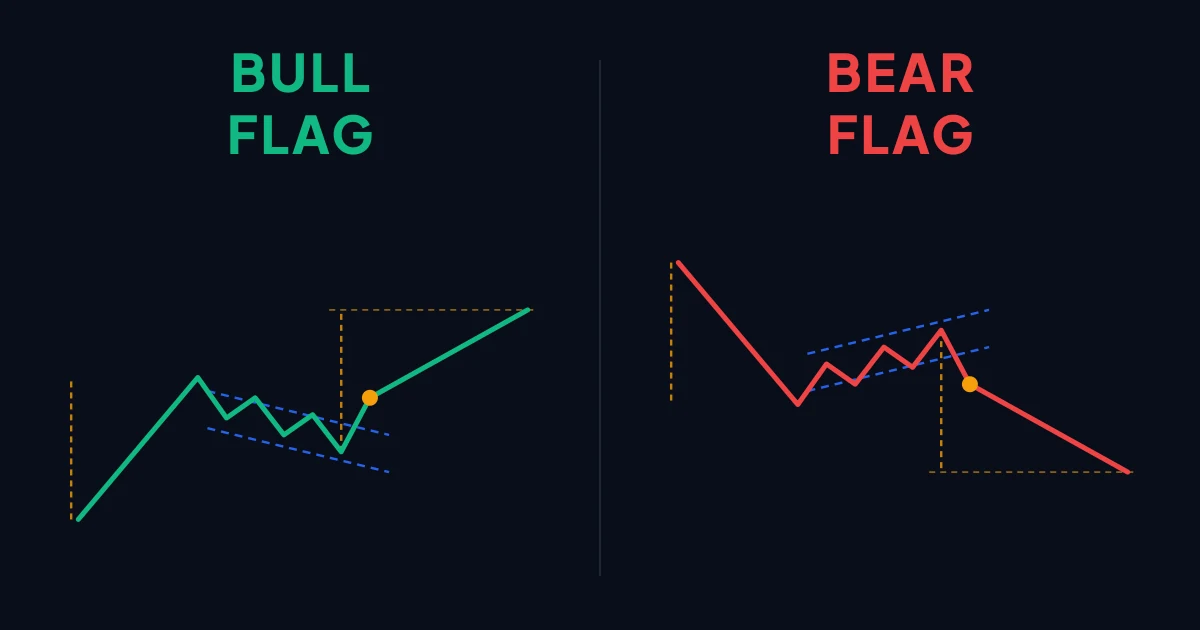
Bull and bear flags are chart patterns in technical analysis that turn up regularly on the price charts of financial assets such as shares, forex pairs or commodities. Both count as continuation patterns, which means they suggest the current trend is likely to resume once a short correction has run its course.
Descriptions of the flag almost always leave out the pole, the sharp run before the correction. Without it the pattern makes no sense.
Without a pole it is not a flag
The pole is the sharp, almost straight move that comes before the correction. Thomas Bulkowski, author of the Encyclopedia of Chart Patterns, states it flatly in his identification rules — no straight-line price run, no flag. StockCharts puts it the same way, flags and pennants have to be preceded by a sharp rise or fall.
The pole is also what the target is measured from.
The second thing descriptions leave out is time. The flag is a short-term formation and the limit is three weeks. Anything that takes longer Bulkowski classifies as a rectangle or a channel. He admits himself that the boundary is a convention, but his entire database sticks to it, so the numbers below apply to formations of up to three weeks.
How the flag is put together matters too. Bulkowski prefers a tight formation to one in which price wanders about, pokes outside the boundaries and leaves empty space inside the pattern.
Bull flag
A bull flag is a pattern that appears during an uptrend. The flag is formed by a falling trend line that runs against the direction of the trend. That line serves as a technical correction in price. Once the correction ends, the original uptrend is expected to resume and carry on.
The slope against the trend is the preferred shape, not a condition. Bulkowski notes that the best results come precisely from an upward entry trend with a flag sloping down, but a horizontal flag is a flag as well.
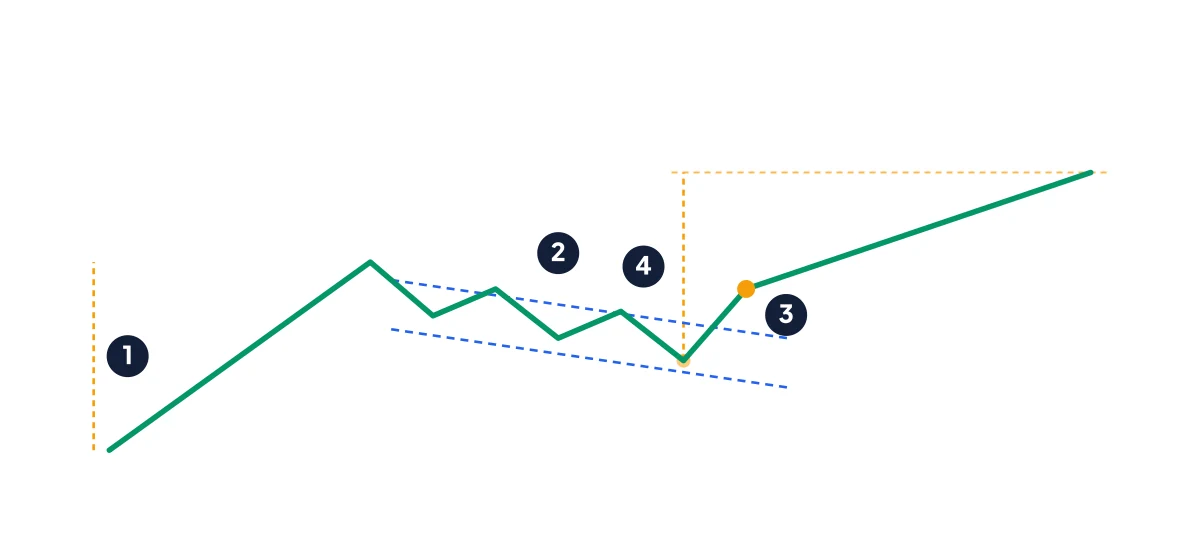
Diagram of a bull flag. ① the pole, the sharp run before the correction. ② the flag, two parallel lines sloping against the trend. ③ the break of the upper line. ④ the measured target, that is the height of the pole carried upwards from the low of the flag. Both orange segments are the same length. Source: own work.
Bear flag
A bear flag is a pattern that appears during a downtrend. The flag is formed by a rising trend line that runs against the direction of the trend. That line serves as a technical correction in price. Once the correction ends, the original downtrend is expected to resume.
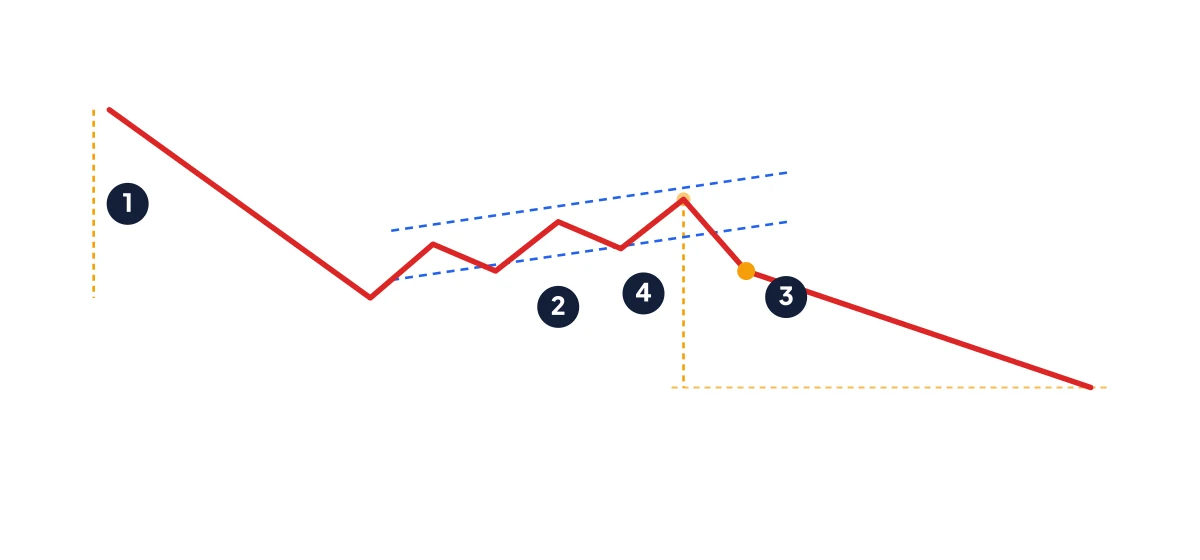
Diagram of a bear flag, the mirror case. ① the pole points down. ② the correction rises between two parallel lines. ③ the break of the lower line. ④ the target, that is the height of the pole subtracted from the upper edge of the flag. Source: own work.
How the flag is traded
These patterns occur in strong trends. They are not reversal patterns, though. Flags confirm the trend, they are essentially corrective moves within it. They take their name from the shape they draw on a chart. A short downward correction can appear inside an uptrend. Price falls over a short space of time, despite the overall upward trend.
Joining the highs within that correction gives one falling line. Joining the lows gives a second one, parallel to the first. The pattern is confirmed by a break of the upper line. It is traded by entering a long position.
In a downtrend it is upward corrections that appear instead. The flag again shows up between parallel lines joining the highs and the lows. This time the pattern is confirmed by a break of the lower line. It is traded by entering a short position.
A break counts as a closing price beyond the line, not a wick that merely pierces it. That is how Bulkowski measures his statistics, so anyone who wants to use his numbers has to count the same way. No measured difference between entering on the wick and entering on the close has been published for the flag, it is a choice made for the sake of comparability.
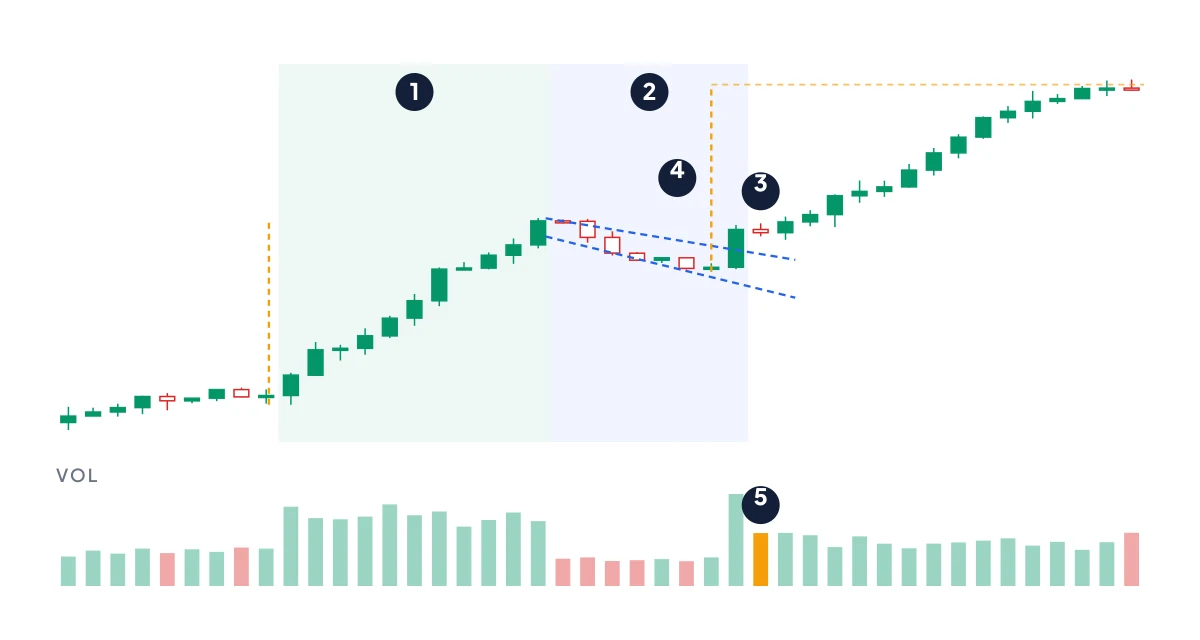
What a flag looks like on a candlestick chart. This is a drawn illustration of the shape, not a record of any particular market, which is why you will find neither a ticker nor prices in it. ① the pole on high volume. ② eight candles of correction in a falling channel, volume declining. ③ the first closing price above the upper line. ④ the measured target. ⑤ volume on the day of the break. Source: own work.
Volume
Volume usually falls inside the flag. Bulkowski measured this in roughly three quarters of cases, 74% to 77% depending on the direction of the break. It is a descriptive property of the pattern, not a condition the setup has to meet.
The volume surge on the break works differently from the way it is usually written up. The classic literature recommends it as confirmation, but Bulkowski never included the ordinary flag in his study of breakout volume, so he publishes no preference for it. For the related formation discussed below it came out the other way round. Reading volume properly is a subject in its own right.
What the numbers will bear
All the numbers below come from Bulkowski’s database as updated in August 2020.
| figure | up | down |
|---|---|---|
| share of breaks in this direction | 60% | 40% |
| fails to reach break-even | 44% | 45% |
| average move after the break | 9% | 8% |
| target from the height of the pole met | 46% | 46% |
Two things belong with this. First, that 44% is measured differently for the flag than for other patterns, from a short-term price swing rather than all the way to the final high. It therefore cannot be compared directly with the failure rate of a head and shoulders. Second, the 60% share of upward breaks applies across all flags regardless of which way the entry trend was pointing. Bulkowski does not publish a figure for continuation as against reversal, and it cannot be derived.
The flag has no place at all in his ranking of patterns, precisely because of the different way it is measured.
Flag, pennant or wedge
They are easy to confuse, and with a wedge it costs money, because the trade goes to the opposite side.
| pattern | lines | length | typical break |
|---|---|---|---|
| Flag | parallel | up to 3 weeks | up 60% |
| Pennant | converging | up to 3 weeks | up 57% |
| Falling wedge | converging | from 3 weeks | up 68% |
| Rising wedge | converging | from 3 weeks | down 60% |
A bear flag, that is a parallel rising channel, looks almost the same as a rising wedge. The wedge, though, breaks downwards in an uptrend in 60% of cases. Converging formations, triangles above all, are a separate topic.
A flag after a hundred per cent run is a different pattern. When price rises by more than 90% in under two months and then consolidates, Bulkowski calls it a high and tight flag and treats it as a pattern of its own with its own numbers, an average rise of 39% and a failure rate of 15%. Those numbers cannot be applied to the ordinary flag, and confusing the two is the most common mistake in texts on this subject.
Where the stop goes and where the target goes
The target is calculated from the height of the pole. With a bull flag that height is added to the low of the flag, not to the point of the break, with a bear flag it is subtracted from the upper edge. It comes off in roughly half of cases, so treating it as the whole position is bold.
The stop belongs below the pattern, but there is a difference between the low of the flag and the lower line. The low is a fixed level, the lower line is sloping and shifts over time. A published study on stop placement that Bulkowski carried out on ascending triangles, double bottoms and rectangles found that a tight stop a few cents below the low of the breakout day is hit in 61.5% of cases with an average loss of 2.19%, whereas a wide stop below the ten-day low is hit in only 14.9% of cases with a loss of 7.53%. Flags were not in the sample, so it is a pointer rather than a measurement on this formation.
The alternative is a stop derived from volatility. For that Bulkowski cites Kaufman’s method, the average daily range over 22 bars multiplied by two and subtracted from the most recent low. When the low of the flag sits closer than ordinary daily noise, a tight stop will throw you out before anything has a chance to happen. Working with stops is covered in more depth in our article on the trailing stop-loss.
Reckon on a freshly opened position pulling back to the edge of the formation first, as it commonly does. Across all types of pattern Bulkowski measured such a return in 58% of cases, with an average duration of ten days. No specific figure for the ordinary flag has been published.
Forex and crypto work differently
Forex is an over-the-counter market where trades do not funnel into one central report, so no overall volume exists. What most platforms draw as volume is tick volume, the number of ticks from a single broker’s feed. MetaTrader draws the distinction itself, it keeps tick_volume and real_volume apart. The condition about falling volume is therefore not verified on currencies with the same quantity.
In crypto the problem is a different one. According to a study published in Management Science in 2023, wash trading accounts on average for over 70% of reported volume on unregulated exchanges. A volume filter makes no sense there and all that is left is the price structure.
Bulkowski’s numbers come from a database of shares on daily data. No comparable statistics on flags for forex, crypto or intraday charts have been published. Anyone trading flags on a fifteen-minute chart of a currency pair has no measurements to go on, only an analogy. What technical analysis can and cannot do in general is a wider question than any single formation.