
The EBITDA multiple is the shortest route from a single number pulled out of the income statement to a valuation of a company. Take earnings before interest, tax, depreciation and amortisation, multiply by the figure customary in the industry, and compare the result with what the company trades for once its debt is counted in.
The result, though, is not what most people expect. The formula gives the value of the whole business — including the part that belongs to lenders. Before it becomes a share price, debt has to come off. Skip that step and a leveraged company gets valued exactly its net debt higher than what actually belongs to shareholders.
What the formula actually measures
The multiple used in practice is called EV/EBITDA. The numerator is enterprise value, the value of every claim on the company put together: market capitalisation plus interest-bearing debt, minus cash and short-term investments. For companies with consolidated subsidiaries, minority interests are added on top.
The formula then reads:
EBITDA × industry multiple = value of the whole business
Enterprise value sits in the numerator for a reason. EBITDA is earnings before interest, so it stands above the claims of lenders and shareholders alike. It therefore has to be compared with a value both groups have a claim on. Use market capitalisation instead and the comparison falls apart: the numerator would measure only the shareholders’ claim, while the denominator would still be earnings out of which the lenders are paid too. A leveraged company would look artificially cheap and a debt-free one expensive.
That is also why the multiple gets used where the price to earnings ratio distorts the comparison: net income comes only after interest and after depreciation, so it blends operations, funding structure and depreciation policy into one number. EV/EBITDA takes two of those three out of the comparison, the funding and the depreciation.
From company value to share price
The missing step weighs as much as the rest of the calculation put together. Net debt comes off enterprise value — interest-bearing liabilities including leases, less cash. Then everything with a claim on the company ahead of the shareholder: minority interests and preferred stock. What is left is equity value, and that gets divided by the diluted share count.
On two companies with identical operations it looks like this.
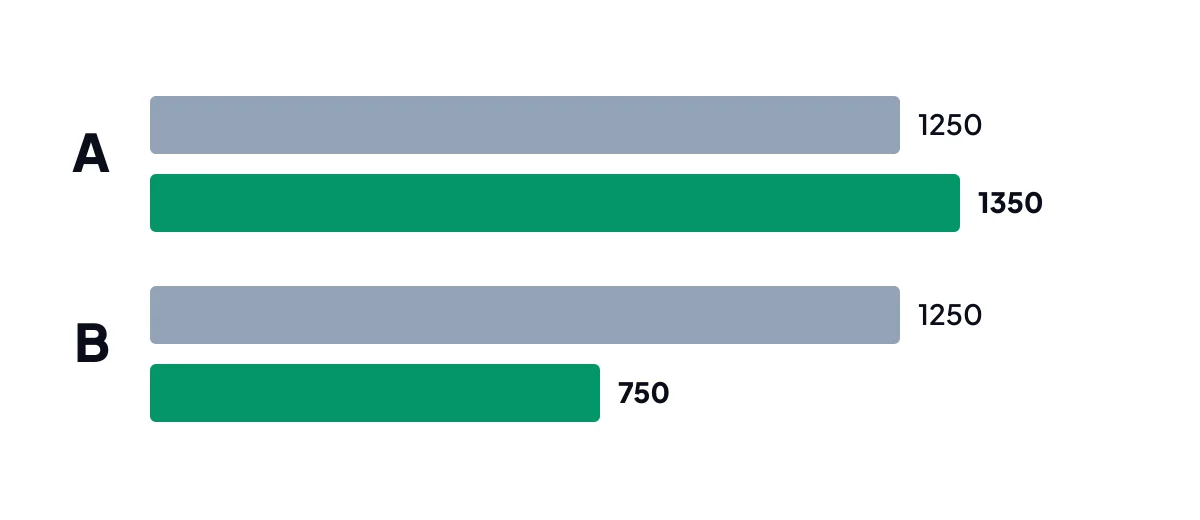
Both report EBITDA of 125 million and at ten times both come out at the same enterprise value of 1,250 million — that is the grey column. The first company, though, has no debt and holds 100 million in cash, so its net debt is negative and the cash gets added to enterprise value: 1,250 + 100 = 1,350. The second owes 500 million, so 1,250 − 500 = 750. The value to shareholders differs by 600 million, or 80 percent — and nobody sees that difference in EBITDA.
It works the other way round as well. Calculate the multiple off the market price of the shares and the leveraged company comes out lower: 1,350 / 125 = 10.8 for the first, but only 750 / 125 = 6.0 for the second. It looks like a discount even though what stands behind it is more leverage.
What the multiples across industries really look like
Industry multiples are published free of charge by Aswath Damodaran of the Stern School of Business in New York, with an update every January. The latest is dated 9 January 2026 and rests on trailing earnings of US companies through the third quarter of 2025.
| Industry | EV/EBITDA | Companies in the industry |
|---|---|---|
| Semiconductors | 34.8× | 66 |
| Software | 24.5× | 309 |
| Retail | 17.4× | 23 |
| Pharmaceuticals | 15.3× | 228 |
| Utilities | 13.7× | 14 |
| Food processing | 10.0× | 78 |
| Wireless telecoms | 9.0× | 12 |
| Airlines | 7.6× | 23 |
| Oil and gas production | 5.2× | 142 |
| The entire US market | 19.7× | 5,994 |
For comparing one specific company, the table is a bearing, not a benchmark. A size-weighted aggregate of an entire industry is something different from a group of companies of similar size, with the same margin and the same capital intensity — and it is exactly that group that has to be assembled before anything gets called cheap.
Why a low multiple is not a discount
The gap against the industry is a hypothesis, not a conclusion. The level of the multiple is a function of expected growth, return on capital, capital intensity and risk. A company with slower growth, heavier investment needs or a less stable business has a lower multiple by right.
It is most treacherous with cyclical companies. They show their lowest multiple at the top of the cycle, when EBITDA is temporarily at its highest — precisely the moment when the share is statistically cheapest and in fact dearest. Mining, chemicals, transport and carmakers behave that way over and over.
And one more trap: relative valuation assumes the surroundings are priced correctly. When a whole industry is overvalued, the “cheap” company is merely the least overvalued one. That is why the result is cross-checked against intrinsic value, typically calculated with the DCF method.
What EBITDA leaves out
EBITDA is not cash. It excludes the change in working capital, taxes paid, interest paid and investment in fixed assets. That last item is the heart of the argument: a company that has to renew machines or networks every year can post high EBITDA and zero free cash flow.
The best-known version of that objection came from Warren Buffett in the Berkshire Hathaway shareholder letter for 2000: he and Charlie Munger shudder whenever EBITDA is mentioned, and he asked whether management thinks the tooth fairy pays for capital expenditure. Two years later he expanded on it: depreciation is a particularly unpleasant cost, because the money for it goes out up front, before the asset it bought has earned anything at all.
The second objection is an accounting one. EBITDA is defined neither in IFRS nor in the US standards — it is a so-called alternative measure that each company sets for itself. The US securities regulator therefore requires filings and earnings releases to show net income under the standards with equal prominence alongside it, together with a reconciliation between the two figures; adjusted EBITDA on top of that may not simply be labelled EBITDA and may not be presented on a per-share basis.
The third point split the time series in half. For reporting periods beginning on or after 1 January 2019, IFRS 16 applies: rent under operating leases stopped being an operating cost and broke apart into depreciation and interest, both of them below the EBITDA line. For companies with large rent bills, reported EBITDA jumped without a single cash flow changing. While preparing the standard, the IASB calculated on a sample of 50 airlines that bringing leases fully onto the balance sheet would lift their combined EBITDA from 51.6 to 73.8 billion dollars; for 204 retail chains, from 270.4 to 347.7 billion. For companies reporting under IFRS, figures before and after 2019 are therefore not comparable. US companies moved to ASC 842, which left operating lease rent inside operating costs — their EBITDA did not move with that jump, and the table above does not suffer the break.
Where the measure does not belong
Banks and insurers. Debt is not how they fund themselves, it is the raw material they trade in. Enterprise value and a corporate cost of capital make no sense for them, and EBITDA is not reported because interest is an operating item. They are valued at the equity level, typically on price to book and price to earnings.
Real estate funds (REITs). The convention is FFO, net income stripped of property depreciation, of gains and losses on property sales and of write-downs in property value. The standard is issued by the US association Nareit. The reason is that accounting depreciation on buildings does not match how their value actually develops.
Companies with negative EBITDA. The result is a negative multiple, as unusable as a negative P/E.
Where the numbers come from
The inputs come from the annual report and from regulatory filings, not from summaries that copy them over. EBITDA itself is derived from those as operating profit plus depreciation and amortisation. With a multiple taken from elsewhere, the sample, the region, the date, whether it is a median or an aggregate and whether it is calculated on trailing or expected EBITDA all have to be known. A multiple built on one definition and an EBITDA built on another produce a number that measures nothing.
Outside valuation, EBITDA turns up most often in loan agreements. ECB banking supervision treats a loan as leveraged when the borrower’s total debt after the financing exceeds four times EBITDA; leverage above six times already raises concerns in most industries. Both thresholds work with total debt — cash is not netted off it.
The industry multiples come from the public NYU Stern dataset, updated in January 2026.