
Free cash flow (FCF) is the money a company has left after covering its operating costs and its investments. It is a different lens from accounting profit: profit says what a company earned under accounting rules, free cash flow says how much money actually ran through its bank account.
At the same company the gap between the two numbers can easily be twofold. Profit can be shifted between periods through the choice of depreciation method or the timing of revenue recognition, whereas cash either arrived or it did not.
One of those caveats is worth expanding on right at the start, because you rarely meet it in articles about FCF. Free cash flow can be managed just as profit can, only with different levers. A company can hold back supplier payments at the end of a quarter, sell its receivables to a factoring firm, or push a machine purchase a few weeks past the period end. In all three cases FCF jumps without anything in the actual business improving. The difference from accounting profit is not that cash cannot be influenced, but that those adjustments come back sooner or later: a deferred payment still has to be made, a deferred investment still has to be caught up.
Warren Buffett is often quoted in this context as a champion of FCF, but that is not accurate. In Berkshire Hathaway’s 1986 annual report he described his own concept of owner earnings — reported earnings plus depreciation minus the investment needed to maintain the company’s long-term competitive position. It differs from FCF in exactly that last term: Buffett deducts only maintenance capital spending, not all capital expenditure, and he adds straight away that it is an estimate, not a figure taken from a statement.
How is FCF calculated?
Two different numbers hide behind the FCF abbreviation, and plenty of texts confuse them. The distinction matters, because each one answers a different question.
Plain free cash flow is taken straight from the cash flow statement:
FCF = Operating cash flow − Capital expenditure (CAPEX)
Free cash flow to the firm (FCFF) is built up from operating profit:
FCFF = Operating profit after tax + Depreciation − Change in working capital − CAPEX
These are not two ways of writing the same thing. They differ by interest after tax, because operating cash flow already has interest paid out of it, whereas FCFF is calculated before debt service:
Operating CF − CAPEX = FCFF − interest × (1 − tax rate)
At a company with annual interest of 20 million and a tax rate of 21 percent, the gap between the two numbers is 15.8 million. Which one to use depends on what you are calculating. FCFF is discounted at the weighted average cost of capital and produces the value of the whole business, from which you reach the value of the shares only after subtracting net debt. Anyone who wants the flow to shareholders directly calculates FCFE, that is FCFF minus interest after tax plus net new borrowing, and discounts it at the cost of equity.
There is a quiet mistake made at this point that can overvalue an entire company. The tax in the FCFF formula is hypothetical — it is calculated as operating profit times the tax rate, as if the company carried no debt at all. The tax actually paid is lower by the interest tax shield. Anyone who plugs the real tax figure from the income statement into FCFF and then discounts at the weighted average cost of capital counts that saving twice.
Operating profit after tax (NOPAT)
Our story begins with operating profit, the heart of the company. Picture a firm with operating profit of 100 million dollars. Not all of that money is genuinely available, though. After tax (say 21 percent, an illustrative rate used for this model example) 79 million is left. That is our starting point.
Depreciation: cash flow’s invisible friend
Depreciation is a chapter of its own. Technically it is a cost the company never actually pays out. It is an accounting figure representing wear and tear on assets. In our case, say 25 million, which comes back into the cash flow. It is like a coin returning to your wallet.
Working capital: the hidden cash trap
Working capital shows how much money is tied up in short-term assets and liabilities. A build-up of inventory, a rise in receivables and a fall in payables all reduce free cash flow.
That third case is the one people get wrong most often. When payables fall, it means the company has genuinely paid its suppliers, so this is another cash outflow — in the total it is added, not subtracted. Picture a company where inventory rises by 10 million, receivables by 5 million and payables fall by 8 million:
(10 + 5) − (−8) = 23 million
That is how much money got sunk into the operating business. Had payables instead risen by 8 million, the change would have been only 7 million, because the company would have financed part of its operations with supplier credit.
Capital expenditure: an investment in the future
Capital expenditure is a bet on the future. New machines, technology, expansion — all of it costs money. In our model example the company invests 40 million in new technology. That money leaves our notional cash box immediately.
The full calculation in practice
- Operating profit (EBIT): 100 million
- Tax: 21 % (an illustrative rate for this example)
- Depreciation: 25 million
- Change in working capital: 23 million
- Capital expenditure: 40 million
100 × (1 − 0.21) + 25 − 23 − 40 = 41 million dollars
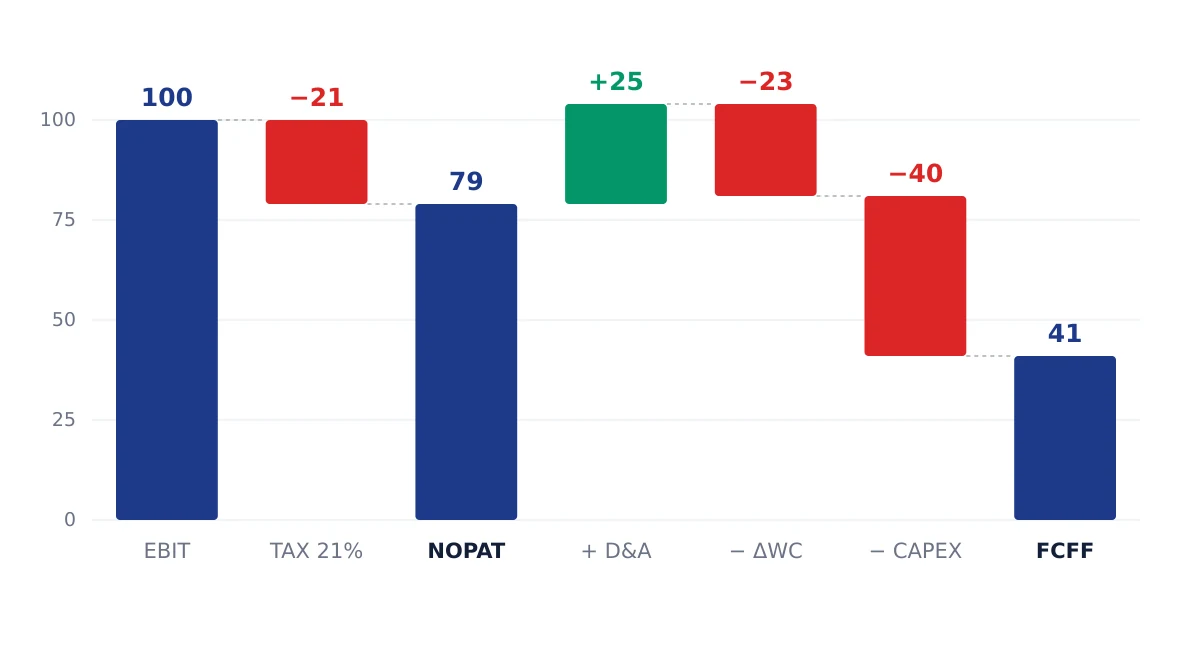
The path from operating profit to free cash flow, in millions of dollars. Tax and investment take money away, depreciation comes back because the company never actually paid it out. The resulting 41 million is FCFF, the flow before debt service.
The most common pitfalls
It is not only about the calculation itself. What matters is following the trend, understanding the context and not treating FCF as an isolated metric. It has to be read against the industry, the company’s own history and its strategic plans. The numbers are only the beginning. Real understanding comes with interpretation, context and the ability to see the story behind them.
How FCF is used when picking a stock
A figure in millions tells you nothing on its own until you put it into a ratio. That is what FCF yield is for, free cash flow divided by market capitalization. A company with FCF of 41 million and a market value of 800 million has a yield of 5.1 percent. It reads much like an interest rate: how much cash the company generates each year for every dollar it costs to buy.
A higher number means the company is cheaper relative to what it actually earns. But a high yield often also means the market is expecting a decline, and a low yield can be perfectly fine at a fast-growing company that puts everything back into growth. That is why it is compared within an industry and over time, not across the whole market.
Technology companies need one correction. Stock-based compensation is added back in the cash flow statement as a non-cash expense, so it flatters free cash flow. The company did not pay out any money, but existing shareholders paid through the dilution of their stake. At companies that hand out equity on a large scale, the gap between reported FCF and FCF adjusted this way is substantial.
And there are sectors where the metric makes no sense at all. At banks and insurers the movement of money is the substance of the business rather than a by-product, so what gets assessed is capital adequacy and net interest income. Real estate funds use FFO instead of FCF, because depreciation on buildings distorts the picture in the opposite direction from usual.
Profit or real money? A practical example
Picture two businesses, a young technology company and a traditional manufacturer. At first glance, going by their accounts, nobody would consider either of them anything special. Their real story, though, sits well below the surface of the usual financial metrics.
The technology startup’s story
The young technology company reported what looks at first sight like a splendid annual profit of 10 million dollars. Management is celebrating, investors are smiling. The reality is quite different. Despite that impressive figure, the company is in fact losing money.
The reason? Enormous investment in the future. Top-end servers, long-term research projects and preparation for the growth it expects have swallowed all the cash. On top of that, the company is waiting for customers to pay: the invoices have gone out, but the money has not arrived yet.
The result is negative free cash flow of minus 5 million dollars. What does that mean in practice? On paper the company looks great, but in reality it depends on outside funding. Every month it “burns” through its reserves, and its long-term sustainability is an open question.
The traditional manufacturer’s story
On the other side stands a traditional manufacturer that looks entirely uninteresting at first glance. Its annual profit is a mere 3 million dollars, an almost negligible sum. Appearances deceive, though. This company is a master of financial management.
Thanks to finely tuned processes it collects its receivables very quickly, runs lean supply chains and needs little investment. Its technology is stable, its costs are carefully controlled. The result? Free cash flow of 20 million dollars.
For investors, a business like that is far more attractive. It has a genuine ability to generate cash, which it can put into dividends, further development, or a cushion for harder times.
The bottom line
Finance people have a favorite saying: “Profit is an opinion, cash is a fact!” Accounting profit can be adjusted in all sorts of ways, you can paint it however you need it. Cash flows will not lie to you. That is why free cash flow matters so much to any investor, analyst or business owner. It shows a company’s real ability to earn and to create value. It is not just a number in a table, it is a living indicator of corporate health.
When you analyze a company, then, it is worth looking at both numbers side by side and above all at how they move over time. A one-off high free cash flow can mean the company merely deferred its investment; a one-off negative one can mean it is building the plant that will earn its keep for the next twenty years. Only several years in a row will show whether the company genuinely produces cash or just shifts it between periods.