
Alpha and beta are two figures used to describe the risk and the performance of a share in relation to the market around it. Diversification removes what is usually called specific risk, the part tied to one company rather than to the market as a whole. What remains is systematic risk — the movement caused by economic, political and social factors that push every traded asset in the same direction at once. That part cannot be diversified away, which is why investors expect to be paid for carrying it. Here is what the two numbers describe:
Beta (β)
Beta, often described as a measure of volatility, sets a single share against the wider market and compares the two over the same period. It says how closely the share has tracked the index, and by how much it has overshot or undershot it. Shares fall into the following bands:
- Beta > 1 = (higher volatility) The share moves in the same direction as the market but with wider swings than the market itself. That cuts both ways, so a broad sell-off is felt harder here.
- 0 < Beta < 1 = (lower volatility) The share follows the direction of the market with smaller swings. Moves are less pronounced and reversals of trend less frequent.
- 0 > Beta > -1 = The share moves against the market, but only mildly. These are securities that trade counter to the trend with limited sensitivity, so the consequences in either direction stay modest.
- Beta < -1 = The share moves against the market and with wider swings. Misreading such a position can be expensive, though the same sensitivity can produce sizeable results for anyone prepared to carry the extra risk.
Alpha (α)
Alpha covers the part of a share’s return that the market movement alone does not explain. It works as a marker of the risk specific to that security and is quoted as a percentage per year, half-year, quarter or month. It sets the return actually achieved over a period against the return that would have been expected had the price moved only in line with its beta, the measure of market risk. In other words, alpha shows how the market has rewarded a share relative to the risks particular to it.
The nature and the size of a company both play a part in whether alpha comes out positive or negative. The figure signals whether the market treats the returns of that business, and of its shares, as different from the average.
These are the readings the indicator can produce:
- ALPHA = 0 = A state of balance, where returns are in line with expectations.
- ALPHA > 0 rising = Above-average returns are expected.
- Falling ALPHA > 0 = Above-average returns may be fading.
- Falling ALPHA < 0 = Below-average returns are expected.
- ALPHA < 0 rising = Expectations are turning, with an effect on the price of the security.
How alpha and beta are calculated
Both come out of the same model. Each one compares the return on the share with the return on the market as a whole.
Beta
β = covariance (stock return, market return) ÷ variance (market return)
This measures how strongly the share has copied the market. A beta of 1.3 means that when the index rose by one per cent, the share historically rose by roughly 1.3 per cent — and fell by as much on the way down.
Alpha
α = actual return − (risk-free rate + β × market premium)
What is left once the market movement and the risk taken on have been accounted for. Positive alpha means the share returned more than its beta would have implied.
Both figures are worked out from history, usually five years of monthly data. They describe how a share has behaved, not how it is going to behave.
Where to find these numbers
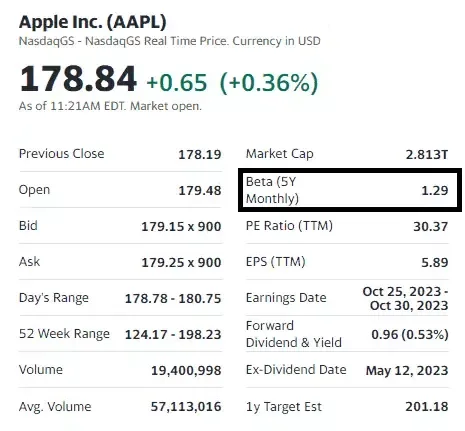
Beta sits on the summary page of most market data portals, generally with a note on the period behind it — most often “5Y Monthly”, meaning five years of monthly observations. Alpha shows up far less often, because it depends on the risk-free rate chosen and on which index is treated as the market.
Values differ between sources, and the gaps can be wide. A different period, a different reference index or a different data frequency will each produce a different number for the same share. A company measured against the FTSE All-Share and the same company measured against a global index will not come out with the same beta. Before putting two businesses side by side, it is worth checking that both readings come from one source and cover one period.
What alpha and beta cannot tell you
Beta says nothing about the quality of a business. A low beta only means the share has moved less than the market, and that can describe a steady company just as easily as a thinly traded one whose price barely shifts because few people deal in it.
Positive alpha from the past does not carry into the future. In individual shares it usually traces back to one specific event that will not repeat, and once dealing costs and charges have been taken off, little of it tends to survive.
Neither figure allows for a company changing shape. After an acquisition, a move into a different line of business or a sharp increase in borrowing, a beta calculated from five years of history is describing a company that no longer exists.
Read together, the two numbers show how a share has responded to the market and how much movement an investor had to sit through to earn the return. Both are backward-looking measures, and that is the spirit in which they belong in any analysis.