The 1970s brought an extreme rise in oil prices, fuel shortages, long queues at filling stations and a worldwide squeeze on stocks. Those events set off panic in the market. Things eventually eased as production grew in places like the North Sea, but oil prices stayed unstable.
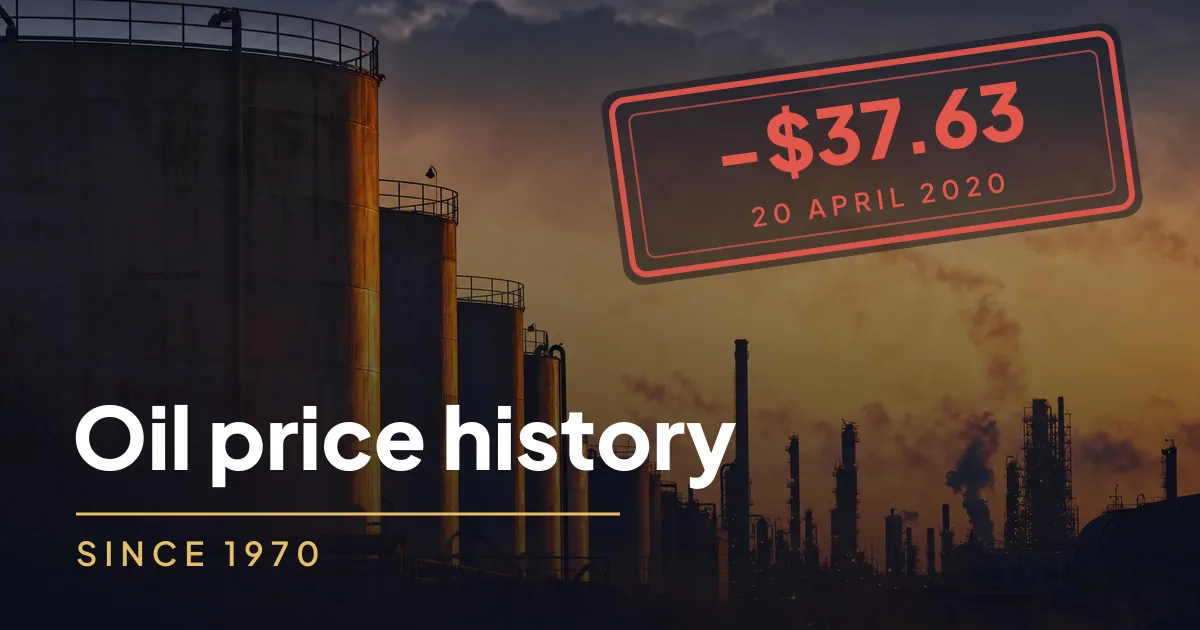
Through the twentieth century oil became the dominant commodity of the world economy. It powered trade, transport, households and industry, and its uses widened further: today it is the feedstock for plastics, fertiliser and medicines. Over the past fifty years the price of a barrel has been through everything from three dollars to one hundred and forty-seven, and once even below zero.
What actually moves the oil price
Before we get to the dates, one mechanism is worth understanding, because it repeats through the whole story.
Demand for oil is very inelastic in the short run. When the price jumps, people still drive to work and factories keep running; consumption falls only a little and only slowly. Supply is just as inelastic: a new field does not come on stream in a month, and a shut-in well does not restart overnight.
It follows that the price is set less by total consumption than by spare capacity, meaning how many barrels a day the market could deliver on top if it had to. When that cushion is thick, an outage is absorbed and the price barely moves. When it is thin, a war, a strike or a hurricane is enough to send the price up by tens of percent.
That is why the chart alternates between sharp jumps and long slow declines. Fear of shortage drives it up; new production, responding to that fear several years late, pushes it back down.
The milestones that rewrote the oil price
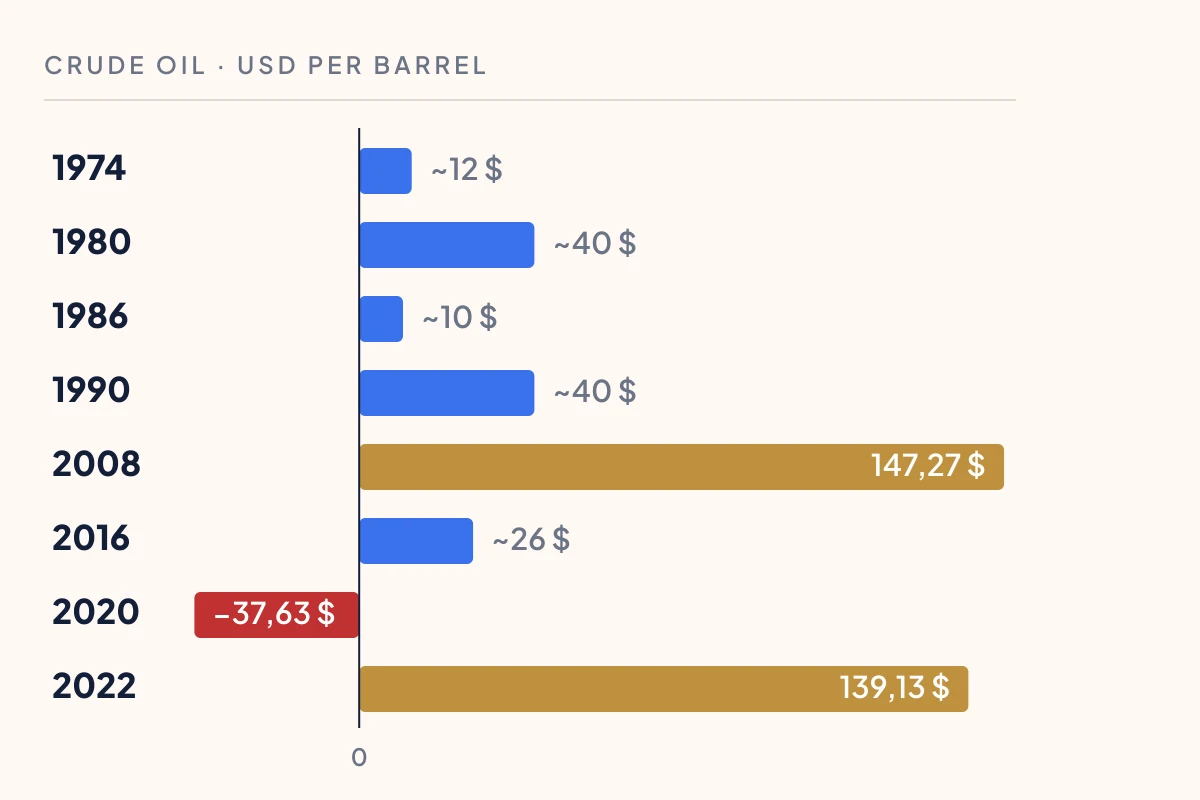 Key price levels in dollars per barrel. Figures marked with a tilde are approximate annual levels, the rest are specific documented quotes.
The oil embargo (1973–1974). The Organization of the Petroleum Exporting Countries cut exports to states that had backed Israel in the Yom Kippur war. The price jumped from around three dollars to twelve, and many countries met an energy crisis for the first time.
The Iranian revolution (1979–1980). The revolution halted Iranian exports and cut world supply. The price climbed towards forty dollars a barrel, a shock comparable in the terms of the day to two hundred now.
The market’s counterpunch (1980–1986). High prices did what high prices always do: it became worth drilling where it had not been worth drilling before. New non-OPEC production flooded the market and the price fell from forty dollars to below ten.
The first Gulf War (1990–1991). The invasion of Kuwait knocked out part of the supply from the Persian Gulf and the price doubled within months from twenty dollars to forty.
China’s rise (2000–2008). This was not a shock but a long pull. Chinese industrial expansion lifted consumption year after year while new production failed to keep pace. Spare capacity thinned to almost nothing and on 11 July 2008 WTI traded at $147.27, still the nominal record.
The shale revolution (2010–2016). US shale production added millions of barrels a day. OPEC chose not to defend its market share and the price fell from a hundred dollars to below thirty.
April 2020: the day oil was worth less than nothing
This is the moment ordinary summaries most often get wrong, so here it is properly.
Covid restrictions cut fuel consumption faster than anyone expected. Oil kept flowing, though, because shutting wells is expensive and slow. The surplus had to go somewhere, and storage capacity at Cushing, Oklahoma, the delivery point for the US contract, was filling up.
Anyone holding the May WTI contract the day before it expired had a problem. They had to find somewhere to physically store the barrels, or pay somebody to take them.
That day is a good lesson in how the price of a commodity differs from the price of a contract on it. If you trade through derivatives, expiry and physical delivery are not a detail but the substance.
2022: the Russian invasion and a second peak
After the covid slump came a recovery in demand that production could not match, and February’s invasion of Ukraine hit an already tight market. Brent jumped in March 2022 to $139.13, only a few dollars below the 2008 record. US WTI rose above $130.
It was the same pattern as 1973 and 1979: a geopolitical shock in a market with little spare capacity. And as always the retreat followed once supply was rerouted and consumption adjusted.
What that is worth in today’s money
Here is the trap that catches almost every survey of historical prices. Twelve dollars in 1974 and twelve dollars today are not the same thing.
Adjusting for US dollar inflation, the 1980 peak lands in the same league as the nominal record of 2008, and on some deflators above it. Conversely the “expensive” oil of recent years looks fairly ordinary once adjusted.
The practical conclusion is simple. If you compare prices across decades, compare them in real terms. A nominal chart says what was paid, but not how much it hurt.
Where to follow oil prices
Current quotes for US WTI, with a chart, are on the WTI oil page. The history is there continuously rather than only in milestones, which makes it a good complement to this overview.
Conclusion
Half a century of oil prices comes down to one sentence: the price spikes when the cushion runs out, and falls when the high price forces new production. The 1973 embargo, the 1979 revolution, China in 2008 and the war in 2022 are variations on the same theme.
April 2020 is then a reminder that in commodities you trade a contract, not the raw material. And the whole run of numbers only makes sense once you convert it into today’s money.