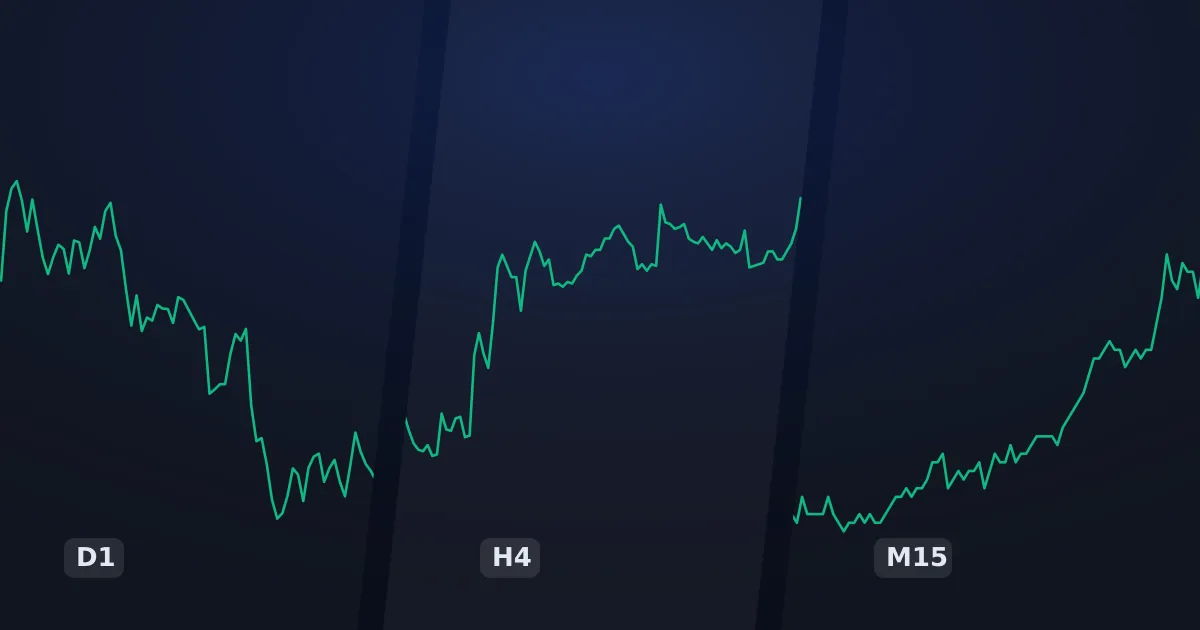
A timeframe (TF) is the length of time on which the price chart of an asset (a stock, a currency pair, a commodity) is drawn. Timeframes can show how long a particular trend holds on the market. Traders are able to recognise those trends, which helps them pin down entry and exit points more precisely. For consistent results it matters that traders understand both trends and time intervals.
Timeframes are therefore meant to help you decide when to enter and when to exit. They are usually split into long-term, medium-term and short-term, and traders often combine several timeframes in their trading.
The basic timeframes
The most commonly used timeframes are these: 1 minute (M1), 5 minutes (M5), 15 minutes (M15), 30 minutes (M30), 1 hour (H1), 4 hours (H4), 1 day (D1), 1 week (W1), 1 month (MN). It is the period that slices the chart into individual parts, each of which shows how the price moved over that particular span.
On a bar or candlestick chart, then, one bar or candle covers a span of 1 minute (M1), 1 hour (H1), a day (D1) and so on.
In the platform the timeframe is switched with a single button, usually in the top left. Watch out for one mix-up: the interval setting is not the same thing as the range of history displayed. Switch the chart from hourly to daily and the length of one candle changes. Click 1M or 1Y in the bottom bar instead and only the visible window moves, while the candle length stays the same.
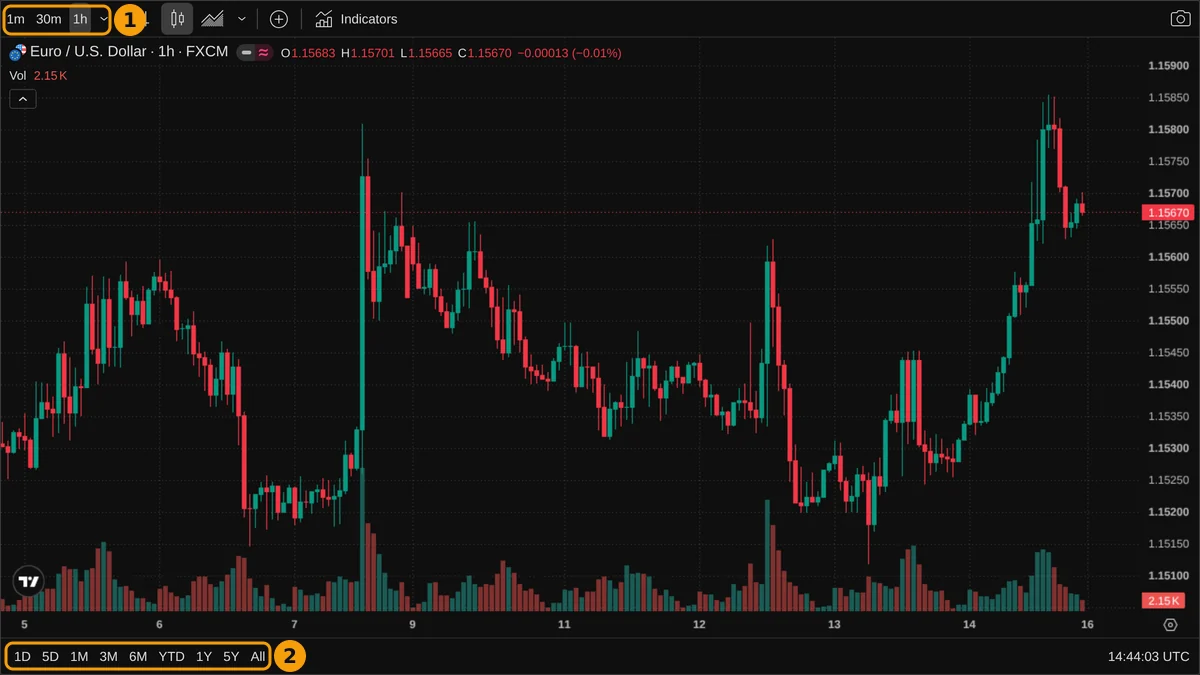 Marked (1) is the interval setting, that is the length of a single candle — that is the timeframe. Marked (2) is the range of displayed history: it moves the window, not the timeframe.
In practical terms, the shorter the timeframe, the more detail the chart shows, the more trading opportunities you get, and the faster the trading itself runs.
If you trade during the day, for instance, you pick the hourly chart as the trend timeframe and the 15-minute chart as the entry timeframe. In that case the hourly candles should help you determine the trend on the market, while the 15-minute candles serve to build the entry points for opening and closing positions in line with the trend identified on the hourly candles.
The gap between the timeframe in which the trend is read and the one in which the trade is placed is a convention, not a rule. Alexander Elder derives his “factor of five” in Trading for a Living from the calendar — 4.5 weeks in a month, 5 trading days in a week, 5 to 6 hours in a trading day — and he himself describes it as approximate; in the Triple Screen method this fivefold step separates the weekly chart, where the trend is determined, from the daily chart, where the signal is sought. Elder’s own entry needs no third chart: the third screen is an order-entry technique, and in the newer 2014 edition he allows that it can be carried out in the same timeframe in which you trade. On 24-hour markets the chain stops fitting altogether, because a trading day there does not have five hours but twenty-four.
Shorter timeframes should help you pin down the price movement within a longer trend line. Trading across several timeframes is useful as a technique and as a strategy precisely because traders can put together their own combinations of timeframes based on the trading style they prefer.
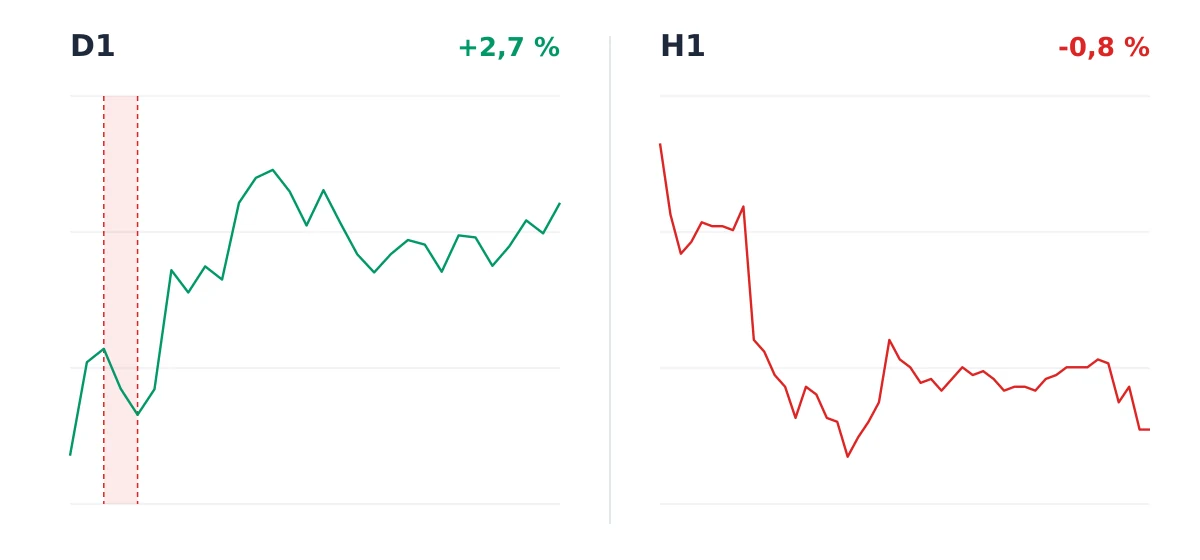 The same market, two timeframes. On the daily chart the price added 2.7% over the month, yet the marked two-day stretch looks like a downtrend on the hourly chart, with a loss of 0.8%. Both are true, each in its own timeframe.
Which timeframe should you trade on?
The very first question that comes up is which timeframe to choose for your trading and your trading style. Traders are free to pick their own timeframes for planning entries and exits. They can choose the timeframe that best matches their trading style and their goals when it comes to short-term, long-term or medium-term trades.
| Timeframe | Who it suits | How long a position is held | How many trades |
|---|---|---|---|
| M1 to M5 | scalping | minutes | dozens a day |
| M15 to H1 | intraday trading | hours, closed before the day ends | several a day |
| H4 to D1 | swing trading | days to weeks | several a week |
| D1 to W1 | position trading | weeks to months | several a month |
The table is not a prescription, but it shows what goes together: the shorter the timeframe, the more trades, the more time at the chart, and the smaller the move that has to be enough to cover the costs.
There is no universally best time to trade. It is up to traders to pick their time spans according to how much time they can devote to watching charts. Longer timeframes are chosen by traders who are after a more detailed analysis for identifying long-term trends. Shorter timeframes, on the other hand, are usually used for quick entries and exits, which makes even dozens of trades a day possible.
- Bear in mind that trading has to feel right — the psychological side of it matters a great deal. The question of the timeframe is a fairly subjective one, and where one trader feels comfortable, another may not.
For one trader the H1 timeframe is very fast, for another it is slow. If you trade daily charts (D1), for example, you will make only a handful of trades a month, because there are fewer trading opportunities than on shorter timeframes.
Conversely, watching minute charts you will get dozens of trades a day. For a beginner, though, that is an unbearably fast style of trading, one that would lead to rash and losing trades.
What the timeframe does to your costs
The choice of timeframe is not only a matter of comfort; it changes the ratio between the expected profit and what the broker takes.
On a minute chart the target move tends to be a few pips, yet you pay the same spread on every entry as you would on a daily chart. Ten trades a day means ten spreads paid, while the move you are being paid from is the smallest of all the timeframes. That is why scalping is so sensitive to the conditions at your broker, and why a beginner usually loses money on it before they manage to learn how to read a chart.
At the opposite end sits position trading. You pay the spread once and it does not concern you, but for every night the position stays open a swap is charged. On a position held for months it turns into the main cost item, one that can outweigh even a decent price move.
In between lies swing trading, where neither of the two dominates. Whatever you choose, work out both costs in advance and build them into the trade plan — not after you have seen the statement.
Why longer timeframes matter
Longer timeframes usually work better for determining and recognising changes in trends and in price movement. Smaller time spans often capture short-term counter-moves in the market, which is why many traders combine several time spans. Using different time spans opens up different opportunities and scenarios for traders. Smaller time spans often signal periodic trend changes, while larger ones identify the main trends.
- The importance of timeframes in trading lies not only in setting the right moments to enter a trade, but also in protecting the original capital so that the trading activity as a whole is profitable.
Timeframes also help with determining the trend, which is the basic task of technical analysis. When we try to identify trends from price movement and market dynamics, longer timeframes gain in relevance. That is because they let traders look over historical charts that reveal the trend lines which held on the market in the past. Understanding trends means traders are likely to be better at judging the outcome of their entry points.