For a moment we will set technical indicators aside and focus on the basic quantity of technical analysis, that is on recognising the trend. The trend is the starting point that indicators are only calculated from. In other words: before you reach for an indicator, work out the trend.
And it matters far less what you trade. Higher highs and higher lows look the same on a currency pair, on oil and on gold, and just the same on the S&P 500 or the DAX. What differs is the speed of the move, the usual size of corrections and the hours when the market is open at all — reading the trend itself stays identical. So you can use the procedure in this text on forex, on commodities, on stock indices and on individual shares.
What a trend is
Based on the direction price is heading, we distinguish two basic types of trend:
- Rising – uptrend / bull trend
- Falling – downtrend / bear trend
We recognise several trends depending on the time period and therefore on the chart. Trends are divided into primary, intermediate and short-term:
- Primary trend — the basic direction of the market. Robert Rhea, who set the theory down in writing in 1932, described it as a move lasting from less than a year to several years and put no lower bound on it; the “longer than a year” quoted routinely today only comes from John Murphy’s textbook.
- Intermediate (secondary) trend — a correction against the primary direction. According to Rhea it usually lasts three weeks to three months and erases 33 to 66 percent of that part of the primary move which has run since the end of the previous correction — not of the whole trend.
- Short-term trend — for Rhea, daily fluctuation on the order of days, rarely longer than a week. The “up to three weeks” boundary is a later simplification, not the original definition. Rhea wrote “usually” in all three cases, because he was describing what he had measured on the indices, not definitional limits.
What matters, then, is what we actually want to trade – and in what way. In practice it can happen that the primary trend is rising – bullish, inside it the intermediate trend is falling – bearish, and inside that the current short-term trend is bullish again. So the question is how long you want to hold positions. As we have already mentioned, it can be a trend within a trend.
The basic rule of traders is that the trend is your friend (a trend is a moving train and on forex in particular it has enormous force – so avoid trading against the trend).
- That means that if we identify the right trend and are in a position with the market, we let profits run to the maximum and cover a possible reversal with a stop-loss order.
- Conversely, when we are against the trend, we try to get out, ideally with at least some profit.
Often, though, a situation arises where the market moves inside a channel in which it is temporarily locked. It jumps up and down, but within the channel lines it gets neither above nor below them. In such a case it is very hard to identify the direction of the trend correctly. What is certain is that after a move like this the market will shoot decisively one way – UP or DOWN.
What types of trend are there?
Correctly recognising and judging where the market is heading is one of the most important tasks of a technical analyst. The market does not develop in a straight line; the price move is accompanied by rises and falls. A trend is a longer-term process of price heading in one direction – up or down. The basic types of trend:
Uptrend
In a rising trend, buyers (bulls) prevail over sellers (bears). Demand prevails over supply and that lifts the price. The rise does not run in a straight line but is accompanied by several areas of rise and fall. In an uptrend, every next high forms above the previous one, and every next low also forms above the previous one.
Downtrend
In a falling trend it is the bears who prevail in the market. Here there is less demand than supply and that pushes the price down. Again, it does not happen linearly. A downtrend is characterised by every next high being lower than the previous one. And every next low being lower than the previous one too.
Trend line
A trend line is a straight line that defines the direction of the move on the forex market. It is drawn into the chart as a line connecting the highs or the lows of the price range. An uptrend line connects the lows while the price rises overall. A downtrend line connects the highs while the price falls overall. Trend lines are traded in two ways. The first is to trade in the direction of the trend until the trend line is broken.
The second way is to wait for the break and trade in the direction of the newly forming trend. But trading on the basis of these lines alone is not recommended. It is good to back the trade up with something else as well, for example technical indicators or chart patterns. Drawing trend lines is not as simple as it might seem. It is a very subjective matter, because everyone can read the situation in the market differently. Two points define the line, and the third touch that does not break it is its first test — until then it is treated as provisional. Confirmation is not a switch, though: the longer the line holds and the more touches without a break it collects, the more weight it carries.
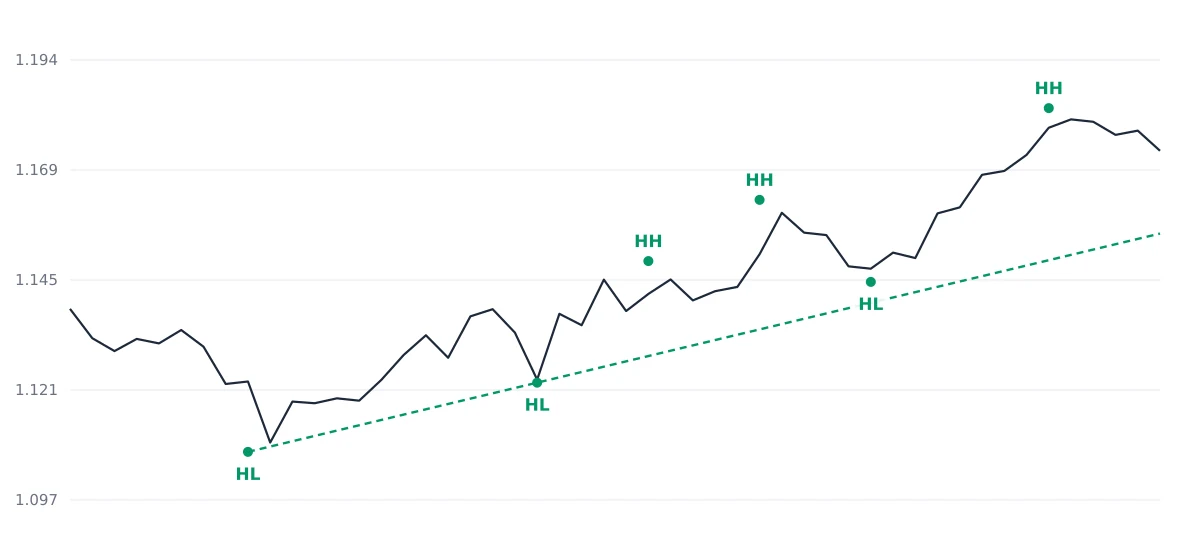 Daily EURUSD chart. Every next high (HH) and low (HL) lies above the previous one, and the line drawn through the first two lows keeps the price above it for the rest of the stretch.
Trends are further divided into trending and trend-less. First we will stop at the one that is closer to us and more predictable, trending, and sum up the definitions at the end.
- Uptrends - We define them as higher highs and lower lows moving up together - the market on the chart simply rises optically over the given time - it grows.
- Downtrends - We define them as a pattern of lower highs and lower lows - the market falls downwards. An uptrend and a downtrend are easy to identify on the chart and you can apply your strategies to them.
- Trend-Less - (a trend that is losing itself) is a move of uneven stretches swinging about in various ways. Here we again recognise two models: choppy - an uneven move of higher highs and lower lows, and sideways – a narrow band of lower highs and higher lows. Formations like these show up in a market moving in a sideways channel.
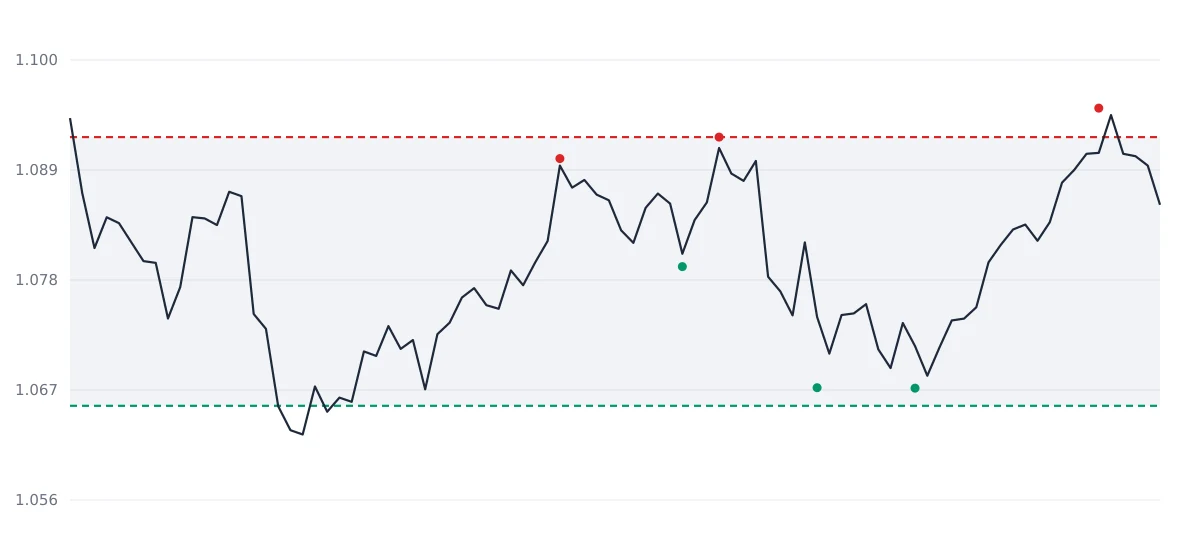 The same pair in a period without a trend. Price bounces between two levels, neither the highs nor the lows shift, and trend strategies have nothing to hold on to here.
How to check a trend without drawing
A trend line is subjective and higher highs can be seen on a chart even where there are none. That is why a second check comes in handy, one where it does not matter who is looking: the position of price relative to moving averages. When price holds above the 50-day average and that one is above the 200-day average, it is a rising arrangement; the opposite order corresponds to a falling one. Averages react with a lag, so they will not tell you when the trend started — they tell you whether it still holds. The crossing of the two averages has a name of its own and we covered it separately.
How to identify a trend on forex
If we look at the trend from the point of view of a candle, the candle can again be divided by the prevailing direction of the market into a trend one and a non-trend one. In the original terminology, the non-trend candle can be called a doji, whose characteristic feature is that its body is very small or almost non-existent. In other words, at that moment neither buyers nor sellers managed to take control of what was going on in the market.
It is also true that the range of the body of a doji on a daily or weekly chart can be several units up to tens of pips, and conversely only tenths of a pip on a five-minute chart. Judging a candle is therefore often very subjective and depends on the type of market, on volatility and on the chosen time frame.
Trend candle
A candle that moves up or down for most of the time from its open can be judged as a trend candle. We can assess it further by its overall shape. If the overall price range of the candle is large (the range from high to low) while its body is small (from open to close), the possible further potential for a move, or the strength of the trend, is also small.
Of course, if we looked at this candle from the point of view of a lower time frame, we could still find several price swings moving in a sideways trend. For the current assessment of the chart on the time frame we have chosen, however, that fact is irrelevant.
More candle tips on forex
The opposite of the above is a trend candle with a very large to extreme body, which can appear on breakouts or in the course of a trend and signals its great strength. Unfortunately it is often not suitable for trading either, because after such a price move the trend is often exhausted and we can rather expect a price correction.
So what is the notional ideal for trading? A healthy picture of a trend is several consecutive rising or falling candles with a medium-sized body without any extremes, which can follow a pullback and throwback price pattern, for example.
Charts
As we have already mentioned, technical analysis relies on finding and examining trends in the development of asset prices. Price movement charts are used for a clear and more understandable picture as well as for easier identification of trends.
Charts are the foundation of technical analysis and every technical trader has to be able to read them perfectly and understand them.
How long does a trend actually last?
There is no generally valid definition that would precisely determine what still counts as a trend and how much of the total time a given asset spends in a trend. Usually, all technical traders in the markets have their own definitions of a trend and of how much time their favourite asset tends to spend in it.
We have to remember that the price of no asset stays in a rising or falling trend the whole time, that every share has periods when its price moves horizontally. And a horizontal price move is not considered a trend — it is a range in which the market is making up its mind.
The time period of the chart.
One of the problems in determining how the price trend is developing is choosing the time period that would capture it best and that would meet our criteria for buying or selling.
If we choose a chart with, say, an hourly interval, we may have no trouble noticing a forming trend that, conversely, can be imperceptible on a chart with a daily interval.
In the same way, when looking at a chart with a daily interval, a trend may not be obvious to us that is clearly visible on a chart with a weekly interval. From this we can see how important it is to choose the right time interval that fulfils our criteria for trading.
Trend strength
Another sign of the strength of a trend on an individual candle is the fact that its open is very close to its low while its close is close to its high. A strong trend is also evidenced by a sequence of consecutive candles in which each one always has a higher open and close in a rising trend, or a lower open and close in a falling trend.
It is important to bear in mind that everything in the market is relative up to the point where the market does the exact opposite of what you thought. In any case, if a non-trend doji candle or a series of consecutive doji candles appears in the market, it means the trend is probably over. Conversely, a series of consecutive doji candles with a small body that have consecutively higher close and high, or lower close and low, can mean the beginning of a rising or falling price move.
For the purposes of trading on forex it is then more useful to divide all candles simply into trend or non-trend ones (close to a doji in shape). This way we can judge one and the same candle as non-trend in a strong trend and, conversely, as a trend candle in a weak trend. This way we are able to quickly assess whether the market is under the control of buyers or sellers, or whether these two groups are in balance and the market is starting to mark time.