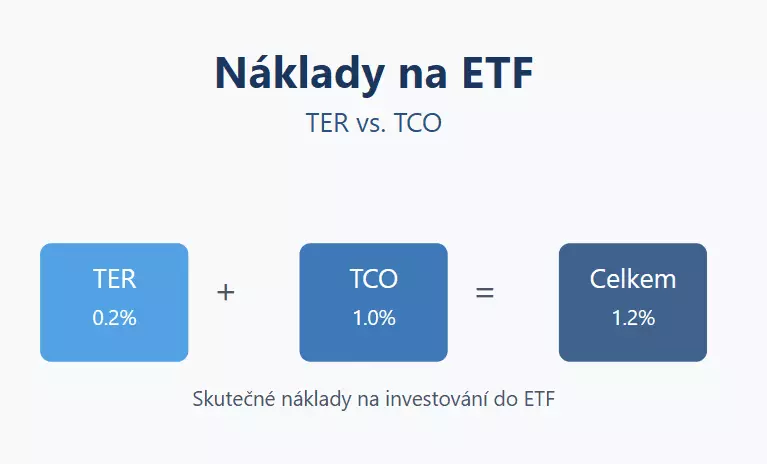
Exchange-traded funds have become one of the most widely used vehicles for long-term investors, and the main reason is cost: they are cheaper to hold than actively managed funds. Even so, charges that look small on paper leave a visible dent in the return over a long horizon.
The trouble is that the number quoted first for any ETF — the total expense ratio — is one item out of several, and usually the smallest one you pay. So let us go through what actually leaves your pocket.
What is the Total Expense Ratio (TER)?
The total expense ratio expresses the annual cost of managing and running a fund. It is taken out of fund assets continuously, so no invoice ever reaches you — it shows up as the fund lagging its index. It is quoted as a percentage of assets under management.
The TER is useful for three reasons:
- Transparency — it gives a clear view of the basic running costs of the fund
- Comparability — it allows a simple comparison of cost across different ETFs
- Predictability — the charge is stable and easy to estimate in advance
The largest slice of the TER, roughly half to four fifths, is the management fee for running the portfolio, tracking the index and rebalancing. The rest goes on administration (accounting, audit, legal), distribution and mandatory documentation, and on depositary fees for safekeeping of securities, trade settlement and monitoring.
What the TER leaves out
This is where the expense ratio is most often overrated. The following sit outside it:
- Transaction costs inside the fund. When the fund adjusts its holdings to match the index, it trades and pays spreads and commissions of its own. On high-turnover indices that is not trivial.
- Swap costs in synthetic ETFs, which replicate the index through a counterparty instead of buying the shares.
- Withholding tax on dividends, which the fund pays in the home country of the shares, before the income is ever credited.
One item pulls the other way: securities lending. The fund lends out part of the portfolio for a fee, the income goes back into fund assets, and the real cost of holding drops accordingly.
All of this rolls up into the tracking difference — the gap between the return of the fund and the return of the index over a given period. That is the number telling you what holding the fund really cost, and on a well-run ETF it tends to come in below the TER. Providers publish it in their factsheets, and it can also be dug out of the annual report.
Typical TER ranges by fund type
| ETF type | Usual TER range |
|---|---|
| Broad equity indices | 0.03–0.20% |
| Government bonds | 0.05–0.20% |
| Corporate bonds | 0.15–0.40% |
| Sector equity ETFs | 0.20–0.50% |
| Factor ETFs | 0.20–0.50% |
| Commodity ETFs | 0.25–0.60% |
| Emerging markets | 0.30–0.70% |
| High-yield bonds | 0.40–0.70% |
| Thematic ETFs | 0.40–0.75% |
The cheapest funds track large market indices, where providers compete for volume. The narrower the mandate, the higher the cost — a smaller asset base is spread across fewer investors, and access to peripheral markets is dearer.
What is the Total Cost of Ownership (TCO)?
The total cost of ownership looks at what buying, holding and selling costs an investor taken together. Alongside the TER it covers:
The spread, the gap between the buying and selling price of the ETF. On liquid funds that is hundredths of a percent; on specialised ones, and in periods of high volatility, it can easily be tenths of a percent or more.
The broker fee for buying and selling — either a fixed amount per order or a percentage of the trade. Plenty of brokers offer better terms for regular savings plans.
Currency conversion when you buy a fund denominated in a currency other than the one your money sits in. On top of the stated fee there is usually a worse rate than the one quoted on the market. A multi-currency account, or picking an ETF in your own currency, takes care of most of it.
What it adds up to
A worked example: an investment in an S&P 500 ETF through a broker charging €10 per order, with a spread of 0.1%, currency conversion of 0.3% and a TER of 0.2%. The costs need splitting into two groups, because they behave in completely different ways.
| Item | €10,000 | €1,000 | When it is paid |
|---|---|---|---|
| Spread (buy + sell) | €20 | €2 | once |
| Broker fee (2 orders) | €20 | €20 | once |
| Currency conversion (2×) | €60 | €6 | once |
| One-off total | €100 | €28 | on entry and exit |
| TER | €20 | €2 | every year |
Over a single year that comes to €120 on the ten-thousand investment (1.2%) and €30 on the thousand (3.0%). But those figures hold for one year of holding only — and this is exactly where the usual misunderstanding starts, because one-off charges dilute the longer you stay in.
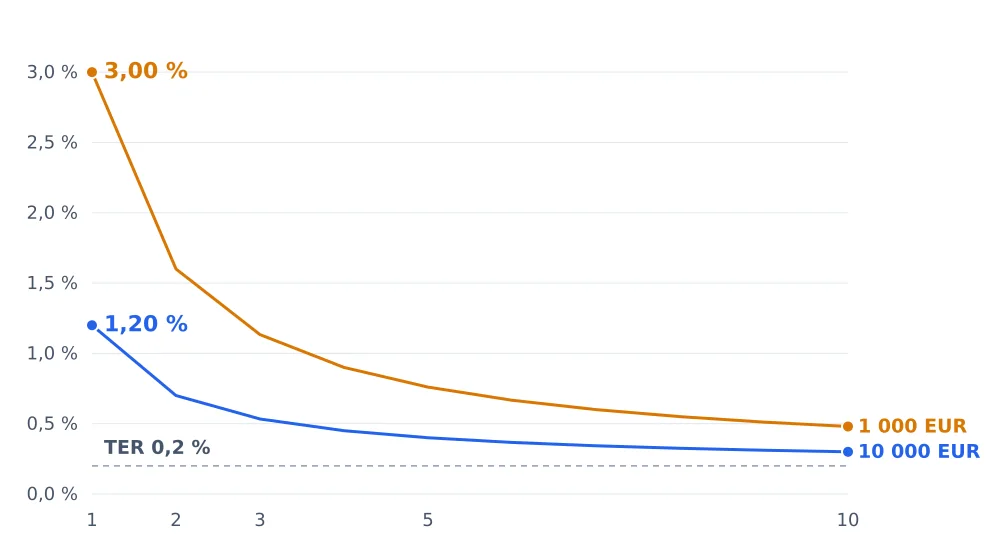 Average annual cost in percent, depending on how long you hold the fund. Both curves fall towards the TER, because buying and selling is paid once.
After five years the average annual cost of the ten-thousand investment is 0.40%, and 0.76% on the thousand. After ten years, 0.30% and 0.48%. The gap between the small and the large investment never disappears, but it loses its drama — three times as wide in the first year, half as wide after ten.
The practical conclusion follows on its own: over a short holding period the entry charges decide, over a long one the TER does. Anyone planning to put in a thousand euro and sell within the year should be looking hard at the broker and the currency conversion. Anyone holding for a decade should be looking at the running cost of the fund.
eToro is a multi-asset investment platform. The value of your investments may go up or down. Your capital is at risk.
On smaller amounts three things help: a broker with no commission on ETF purchases, a regular savings plan with better terms, and buying an ETF in a currency you already hold. On small tickets the conversion is usually a bigger line item than the order fee itself.
Where to find the costs
The basic figures live in the KID (Key Information Document), which replaced the earlier KIID on 1 January 2023 and is mandatory for every fund offered to retail investors in the EU. It gives you not only the TER but a summary of entry, exit and transaction costs inside the fund.
The fund factsheet is a useful supplement, since alongside the TER it usually shows performance against the index over several years — the raw material for tracking difference. For fees and conversion rates, go to the price list of your broker. Specialised comparison sites such as justetf.com are handy for a quick cost comparison across funds.
Summary
Comparing the TER is not enough when picking an ETF. Over a holding period of under a year the one-off costs dominate — the spread, the broker fee and currency conversion. Over five years and more those items dilute away and what decides is the running cost of the fund, captured most accurately by tracking difference rather than the TER alone.
For regular investing of smaller amounts, look for a broker with no commission on ETF purchases; for larger one-off investments, focus on a cheap fund that tracks its index well.
What do I actually pay on an ETF?+
Besides the management fee (TER) of 0.1–0.7% a year, you pay the spread on buying and selling, a broker fee and, where relevant, currency conversion. In the first year the total is typically a multiple of the TER itself, though the gap narrows the longer you hold.
Is a small ETF investment worth it?+
On small amounts fixed order fees do the most damage. Pick a broker with no purchase commission, an ETF in a currency you already hold on the account, and plan to stay in — on a thousand-euro investment the average annual cost falls from 3.0% in the first year to under half a percent after ten years.
Where do I find the real cost of an ETF?+
The TER and a cost summary are in the KID, the spread you can see directly in your trading platform, and the fees in the price list of your broker. To see how well the fund actually tracks its index, look at its performance against the index in the factsheet.
Information on the KID follows the PRIIPs regulation. The model calculation uses the parameters stated in the article, not the offer of any particular broker.