
The fee is the only thing about an index fund that you control. The index return is what it is, and whatever the fund takes it takes again every year you hold the position. The gap between 0.05% and 0.50% a year looks trivial on paper, yet after thirty years it eats more than a tenth of the final value.
Why this article lists no US tickers
English-language rankings of the cheapest ETFs are topped by SPLG (0.02%), VOO and IVV (0.03%), QQQ, BND and GLDM. All of them are domiciled in the United States, and a retail investor cannot buy them through a European broker.
The obstacle is the PRIIPs regulation, in force since 1 January 2018, which requires the seller to hand a retail investor a key information document (KID) before the trade. US issuers do not produce one, so brokers operating in Europe block the purchase.
The European counterparts cost a little more than the US originals — part of the difference pays for the stricter UCITS rules.
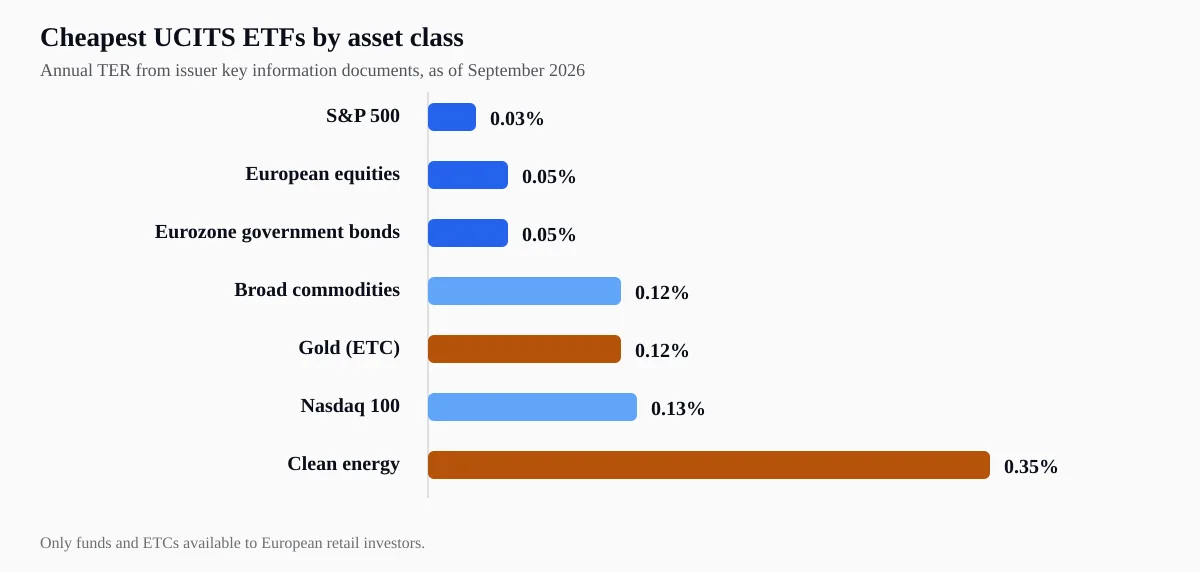
The lowest annual cost in each asset class. Source: issuer key information documents and factsheets.
S&P 500 ETFs
The cheapest European funds tracking the S&P 500 cost 0.03% a year. Both are share classes of the same State Street fund. We went through them in more detail in the article on how to buy and invest in the S&P 500 index.
| Fund | ISIN | TER per year | Dividends | Replication |
|---|---|---|---|---|
| SPDR S&P 500 UCITS ETF (Acc) | IE000XZSV718 | 0.03% | reinvested | physical |
| SPDR S&P 500 UCITS ETF (Dist) | IE00B6YX5C33 | 0.03% | paid quarterly | physical |
| iShares Core S&P 500 UCITS ETF | IE00B5BMR087 | 0.07% | reinvested | physical |
| Vanguard S&P 500 UCITS ETF (Acc) | IE00BFMXXD54 | 0.07% | reinvested | physical |
| Invesco S&P 500 UCITS ETF | IE00B3YCGJ38 | 0.05% + 0.07% swap | reinvested | synthetic |
The Invesco factsheet gives an ongoing charge of 0.05% and a separate 0.07% for the swap. The total cost is the sum of both.
Nasdaq 100 ETFs
The US QQQ and QQQM cannot be bought in Europe. Two European funds tie for cheapest on the Nasdaq 100 at 0.13% a year — one from UBS, one from Amundi.
| Fund | ISIN | TER per year | Dividends | Replication |
|---|---|---|---|---|
| UBS Nasdaq-100 UCITS ETF (Acc) | IE000SB4G4I4 | 0.13% | reinvested | physical |
| Amundi Core Nasdaq-100 UCITS ETF (Acc) | IE000A2YGZU5 | 0.13% | reinvested | physical |
| Xtrackers NASDAQ 100 UCITS ETF 1C | IE00BMFKG444 | 0.20% | reinvested | physical |
| Amundi Core Nasdaq-100 Swap | LU1829221024 | 0.22% | reinvested | synthetic |
| Invesco NASDAQ-100 Swap | IE00BNRQM384 | 0.20% + 0.05% swap | reinvested | synthetic |
| Invesco EQQQ NASDAQ-100 UCITS ETF | IE0032077012 | 0.30% | paid quarterly | physical |
| iShares NASDAQ 100 UCITS ETF | IE00B53SZB19 | 0.30% | reinvested | physical |
0.30% is more than double 0.13%. Both of the cheapest funds are young, though — the UBS one has been running only since March 2025. The largest is the iShares fund at $28.25 billion in assets, and the longest track record belongs to Invesco EQQQ, which has been going since 2002.
European equity ETFs
This is where most people pick the wrong index rather than the wrong fund. “European shares” means three different things, and the difference between them is bigger than the difference in fees.
STOXX Europe 600 covers 600 companies from seventeen countries including Britain and Switzerland, so it holds Nestlé, Roche, AstraZeneca and Shell. MSCI Europe is almost the same thing, with 396 large and mid-cap companies from sixteen countries. EURO STOXX 50 is something else — fifty companies from the single currency area, without Britain and without Switzerland. As a bet on the eurozone it makes sense, as “European shares” it does not.
| Fund | Index | ISIN | TER per year | Replication |
|---|---|---|---|---|
| Amundi Prime Europe UCITS ETF DR | Solactive Europe Large & Mid | LU1931974262 | 0.05% | physical |
| UBS Core MSCI Europe UCITS ETF | MSCI Europe | LU0950668524 | 0.06% | physical |
| Amundi Core STOXX Europe 600 | STOXX Europe 600 | LU0908500753 | 0.07% | physical |
| iShares STOXX Europe 600 UCITS ETF | STOXX Europe 600 | IE000XSFZL82 | 0.07% | physical |
| iShares Core MSCI Europe UCITS ETF | MSCI Europe | IE00B4K48X80 | 0.12% | physical |
| HSBC EURO STOXX 50 UCITS ETF (Acc) | EURO STOXX 50 | IE000MWUQBJ0 | 0.05% | physical |
| Invesco EURO STOXX 50 UCITS ETF | EURO STOXX 50 | IE00B5B5TG76 | 0.05% + 0.35% swap | synthetic |
With the Invesco fund on the EURO STOXX 50, the advertised 0.05% is only the ongoing part. Add the 0.35% swap and the fund works out at 0.40% a year.
Bond ETFs
The US BND and AGG are closed to European investors. The substitute is a global aggregate fund hedged to the euro, because without the hedge the bond portfolio picks up the currency risk that bonds are bought to avoid in the first place.
| Fund | Segment | ISIN | TER per year |
|---|---|---|---|
| Amundi Prime Euro Government Bond | eurozone government bonds | LU2089238898 | 0.05% |
| Vanguard EUR Eurozone Government Bond | eurozone government bonds | IE00BH04GL39 | 0.07% |
| iShares Core € Govt Bond UCITS ETF | eurozone government bonds | IE00B4WXJJ64 | 0.07% |
| Amundi Core EUR Corporate Bond | corporate bonds | LU2089238625 | 0.07% |
| Vanguard EUR Corporate Bond | corporate bonds | IE00BGYWT403 | 0.07% |
| iShares Core € Corp Bond UCITS ETF | corporate bonds | IE00B3F81R35 | 0.09% |
| Vanguard Global Aggregate Bond EUR Hedged | global aggregate, hedged | IE00BG47KH54 | 0.08% |
| iShares Core Global Aggregate Bond EUR Hedged | global aggregate, hedged | IE00BDBRDM35 | 0.10% |
Vanguard cut the fee on its global aggregate fund from 0.10% to 0.08% on 1 July 2025. Hedged share classes cost roughly 0.05 percentage points a year more than unhedged ones.
Commodities and gold
In Europe you cannot buy gold as an ETF. UCITS rules require a fund to be spread across several assets and a single commodity fails that test, so gold is held through an ETC, an exchange-traded commodity.
With a fund the assets are ring-fenced from the manager. With an ETC you hold a claim on the issuer, albeit one secured by stored metal.
| Product | Form | ISIN | Fee per year |
|---|---|---|---|
| Xtrackers Bloomberg Commodity Swap | UCITS ETF | LU2278080713 | 0.12% |
| L&G All Commodities UCITS ETF | UCITS ETF | IE00BF0BCP69 | 0.15% |
| iShares Diversified Commodity Swap | UCITS ETF | IE00BDFL4P12 | 0.19% |
| Invesco Bloomberg Commodity UCITS ETF | UCITS ETF | IE00BD6FTQ80 | 0.19% + 0.15% swap |
| iShares Physical Gold ETC | ETC | IE00B4ND3602 | 0.12% |
| Invesco Physical Gold ETC | ETC | IE00B579F325 | 0.12% |
| WisdomTree Core Physical Gold | ETC | JE00BN2CJ301 | 0.12% |
| Xetra-Gold | ETC | DE000A0S9GB0 | no management fee |
Xetra-Gold has traded in Frankfurt since December 2007 as a bearer bond.
Thematic clean energy ETFs
While a broad equity index starts at 0.03% a year, clean energy starts at 0.35%, roughly ten times higher.
| Fund | ISIN | TER per year |
|---|---|---|
| Xtrackers MSCI Global SDG 7 Clean Energy | IE000JZYIUN0 | 0.35% |
| Amundi Global Bioenergy UCITS ETF | LU1681046006 | 0.35% |
| L&G Clean Energy UCITS ETF | IE00BK5BCH80 | 0.49% |
| Global X CleanTech UCITS ETF | IE00BMH5YL08 | 0.50% |
| Deka Future Energy ESG UCITS ETF | DE000ETFL607 | 0.55% |
| Amundi MSCI New Energy UCITS ETF | FR0014002CG3 | 0.60% |
| Invesco Global Clean Energy UCITS ETF | IE00BLRB0242 | 0.60% |
| iShares Global Clean Energy Transition | IE00B1XNHC34 | 0.65% |
The US ICLN, cited in the rankings as a cheap option, is once again a fund you cannot buy. Its European namesake from iShares costs 0.65%, almost twice as much.
What the fee costs over thirty years
A lower fee shows up mainly through compounding. Whatever the fund takes in the first year never earns anything again, and that shortfall multiplies with every year that follows.
The worked example takes a one-off investment of €4,000 held for thirty years at a gross annual return of 7%, and compares three fee rates.
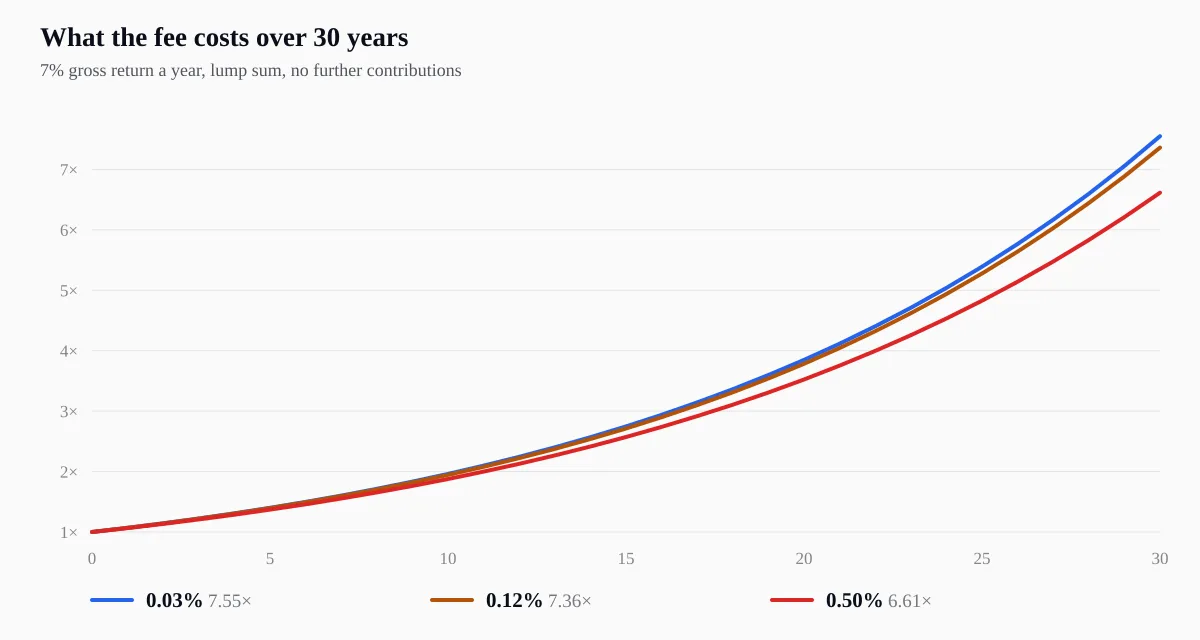
Model example. 7% gross return a year, a thirty-year horizon, three levels of annual fee.
At 0.03% a year the investment grows to €30,200. At 0.12% it reaches €29,400, eight hundred euros less. At 0.50% you are left with €26,500 — €3,700, or about 12%, below the cheapest option.
Over a five-year horizon the difference between the rates is negligible. It opens up in the last third of the thirty-year period.
What to look at besides the fee
Fund size. A small fund is harder to trade, and the issuer may close or merge it. The difference between a fund holding a hundred million euros and one holding ten billion matters more to an ordinary investor than a hundredth of a percent in fees.
Tracking difference. The fee tells you what the fund charges. Tracking difference tells you how far it actually fell behind, and with a well-run fund the two numbers sit close together.
Accumulating or distributing class. The accumulating class reinvests dividends itself, while the distributing one pays them into your account. The pairs in the tables above are often the same fund in two classes with the same fee.
Availability at your broker. Check whether your platform offers the fund before you settle on it, because the range on offer differs from broker to broker.
eToro is a multi-asset investment platform. The value of your investments may go up or down. Your capital is at risk.