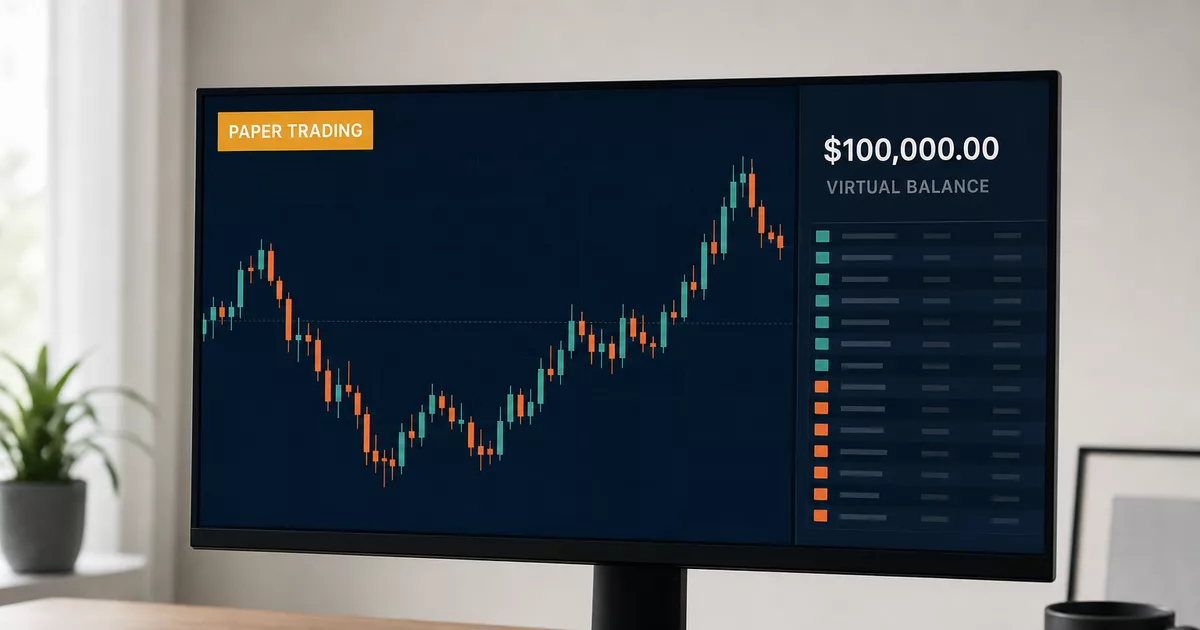
A trading simulator hands you a virtual balance, lets you place orders against real price data and works out the result, except that none of it reaches an exchange. Five fairly different tools sit under that one name. They differ in the data they run on, in what you actually practise on them and in the point where they stop matching the market.
Most people picture a broker demo account. That is one option out of five, and for a large slice of practice it is the slowest one, because a demo runs in real time. Fifty trades on a swing strategy take months there. In a bar replay you get through the same fifty in an afternoon. Fast-forwarding time is the one thing a demo cannot do, and that is the main reason to keep a simulator alongside it.
How a stock market simulator works
A simulator rests on three parts: a price source, a virtual balance and the rule that decides how your order gets filled. The first two are obvious at a glance. The third one decides the outcome, and every tool handles it differently.
The American broker Webull spells the fill rule out in its help pages. Trades are filled at the last price in real quotes rather than at bid and ask, and an order goes through as soon as the price matches, whatever the volume. A single trade in a single share at your price is enough to open the position. Neither the spread nor the queue in the order book exists in that model.
TradingView is more honest about it. Profit and loss come from bid and ask rather than from the price drawn on the chart, with a long counted as the difference between the bid and the average fill price and a short the other way round. Commissions are switched off by default, though, and on futures and options you have to type the per-contract rate in yourself. Leave it out and the simulator prices your trades as if they cost nothing.
Broker demos come with simplifications of their own. XTB states that execution always happens at current prices under Market execution and is not affected by transaction size. A position worth a million fills as smoothly as one worth a thousand.
Five types of simulator and where they part ways
| Tool type | What you practise | Data | Where it breaks down |
|---|---|---|---|
| Paper trading | orders, stop-loss, leverage and margin | own feed (crypto live, shares often delayed) | commissions off, docs silent on slippage |
| Bar replay | reading a chart bar by bar, entry timing | historical data, depth set by the plan | paid plan, no positions and no balance |
| Game or competition | a portfolio under the organiser’s rules | delayed 15+ minutes (Planspiel Börse live) | short round rewards risk, access via school |
| Broker demo | the live platform of one broker | eToro live, XTB share CFDs delayed | position size ignored, no dividends |
| Spreadsheet or tracker | regular deposits, dividend reinvestment | entered by hand, tracker adds prices | no execution, no intraday movement |
Paper trading in an analysis platform
TradingView gives paper trading away on every plan, including the free Basic tier. You switch it on from the chart with the Trade button, pick Paper Trading and confirm the connection. On it you get three separate ways of placing an order (the order ticket, the DOM and trading straight off the chart), work with leverage and margin, and several levels of stop-loss and take-profit on a single position. It also covers how a futures position behaves through expiry and settlement, trading outside the main session, and hooking your own Pine Script indicators up to a live market. Shares, forex, crypto and both commodity and index futures are included.
The prices come from TradingView’s own feed rather than from a broker. Every crypto exchange on TradingView supplies data in real time, but share and futures exchanges charge exchange fees that the subscription does not cover. US shares default to Cboe, and real-time data straight from NASDAQ, NYSE or ARCA is a separate data package. On most shares you are therefore practising over delayed prices until you pay for the exchange feed, which distorts entry timing.
Webull paperTrade offers unlimited virtual funds and no commission, but Webull Financial LLC does not open accounts for residents outside the United States and bans access through a VPN. The European entity, Webull Securities (Europe) B.V., supervised by the Dutch AFM, does have PaperTrade, though only for shares, ETFs and options, and it publishes no list of the other EU countries where an account can be opened. For a reader in Britain that is not a usable route at the moment. The European documentation also says nothing at all about the rule its simulated orders fill by.
Bar replay and backtesting
Bar Replay on TradingView moves the chart forward one bar at a time and hides what comes next. You spot patterns and zones at the moment they are forming, and you hold a trade across several candles without knowing how it ends.
The free Basic plan does not include Bar Replay, which starts on the cheapest paid tier. The plan also sets how far back the history goes. The cheapest paid tier gives roughly half a year of one-minute data, and the limit multiplies by the interval, so a two-minute chart reaches twice as far. Higher tiers give a year and more. Second data exists from August 2022, and one-minute data on most symbols reaches back to somewhere between 2000 and 2011.
Two limits apply, one technical and one human. The technical one sits in the smallest replay step, which follows the chart type. Second charts move a second at a time, intraday and daily charts a minute at a time, weekly and monthly charts only in whole days. A weekly candle cannot be played out any finer than that. Renko, Kagi, Point and Figure, Range, Line Break, Volume Footprint and TPO charts do not work with it, and neither do spread and tick charts.
The human limit does more damage. Nothing in the replay stops you switching to a higher timeframe, dragging the slider forward or simply remembering the outcome from last time. And since Bar Replay keeps no record of positions, commissions or balance, being a chart reader rather than an account, you have to log the results somewhere else.
Games and competitions
HowTheMarketWorks is free and advertising-funded, and the organiser sets the rules: starting cash anywhere from 10,000 to 500,000 dollars, a commission per trade, a cap on any single position as a share of the portfolio, whether shorting is allowed, margin at 8 percent interest and a minimum share price. Its own recommended classroom setup runs 100,000 dollars, a 10 dollar commission per trade, day trading on, shorting and margin off, a 20 percent position cap and a 3 dollar minimum share price. Quotes lag by at least 15 minutes, so nothing time-sensitive can be practised on it.
Wall Street Survivor hands out 100,000 dollars of virtual money and runs monthly contests. Its marketing talks about data in real time, while its own rules admit a delay of at least 15 minutes. Real bid and ask apply only to US exchanges during their trading hours. MarketWatch runs the Virtual Stock Exchange free after registration, with more than 20,000 games in progress, and states the same delay in its footer.
The European counterpart is Planspiel Börse, run by the German savings banks. Each player gets two accounts of 50,000 euros, one for practice and one for the contest. Euro-denominated shares, funds, ETFs and bonds are traded, with cryptocurrencies and index certificates added in the practice account. Virtual fees come off every order, and prices arrive in real time from the Stuttgart, Vienna and Luxembourg exchanges. A round is tied to a partner savings bank and aimed at pupils, students and teachers. Registration tends to open in autumn, the round closes in winter, and the participating savings bank announces the dates.
The Stock Market Game, run by the American SIFMA Foundation, puts teams of up to five students to work with 100,000 dollars and forces diversification through its rules: at least three different shares by the end of week five, no more than 30 percent of capital in one company, nothing priced under 3 dollars. It charges 5 dollars a transaction and 7 percent a year on a debit balance. Summer rounds tend to be free, rounds during the school year are paid per team depending on the coordinator and the length of the round (10 to 30 dollars, for instance 20 dollars for an autumn round and 30 for a full year), and taking part goes through a school.
All of these contests share one flaw. The highest return over a single round wins, and a round lasts a month to four months depending on the organiser’s settings. Over a window that short, a concentrated bet beats careful risk management. Organisers rein it in with position caps and compulsory diversification, without being able to remove it altogether.
Simulating long-term investing, not just individual trades
A trading simulator answers the question of whether one entry worked. Investing asks something else: what a regular monthly contribution does over ten years, how much reinvested dividends add, whether rebalancing back to target weights once a year is worth the trouble. Paper trading is a poor tool for that. It runs in real time, and a contest round is over in a few months.
The simplest long-term portfolio model fits in a spreadsheet built from monthly closing prices. One row per month, a column for the contribution, a column for the number of units, a column for the dividend. No registration and no broker are needed, and you can see exactly what you are calculating. The price for that is a model with no execution and no intraday movement, data you have to key in yourself, and nobody to check your formula.
A ready-made version of the same idea sits in portfolios on Google Finance and Yahoo Finance. Both keep a real position with the number of units, the purchase date and the cost, and work out the gain against the current price. The entry is still manual. Google offers no connection to a brokerage account at all, so every purchase and sale gets written in by hand, although besides the form it will also take a CSV file or a screenshot of a statement. Yahoo does link to a broker, and its manual entry is the more detailed of the two: buy, sell and short transactions, individual purchases including reinvested dividends, and a separate cash record.
For a British portfolio the difference between them matters. The London Stock Exchange is one of the venues Google Finance quotes in real time, alongside Frankfurt, Borsa Italiana and the Nasdaq OMX exchanges in Stockholm, Helsinki and Copenhagen. Yahoo carries London as well, under the .L suffix, but on a delay of 15 to 20 minutes like the rest of its European coverage, which runs from .F and .MI through .PA, .PR, .WA, .BD and .VI. On Google the rest of Europe sits 15 minutes behind too, covering Euronext in Paris, Amsterdam and Brussels, BME in Madrid, the Swiss SIX, Warsaw and Vienna. Prague and Budapest do not appear on Google’s list at all. Keeping transactions, dividends and cash on Yahoo is free, and the paid tiers only add return and risk analysis of the portfolio.
If you want something already built, the educational games with forced diversification and a fee per trade come closest to long-term thinking, precisely because they push you to hold several holdings and pay for every change. Practice at holding for years is still beyond them, because the round is over in a few weeks.
Setting the simulator up so the practice counts
Set the capital you will actually start with. eToro adjusts the balance through a request to customer support, with a top-up of at most 100,000 dollars, and XTB has a Change Balance button in Client Office, which its international help pages offer to clients with a live account open. In games the organiser sets the starting cash.
Turn commissions on. TradingView keeps them off and expects you to type the per-contract rate for futures and options yourself. Without it, a strategy that trading costs would grind down to nothing still comes out in profit.
Keep position size constant for the whole test. Risk a percent on one trade and a tenth of the account on the next, and the series measures nothing. One random trade ends up deciding the result.
Log your trades outside the simulator. Bar Replay keeps no positions and no balance, so it otherwise leaves nothing behind. In paper trading the log is the only thing that survives an account reset.
Do not reset the account after every loss. A reset costs one click and no money, but it wipes the one thing with any value, an unbroken run of results.
Where the simulation flatters you
Emotion is missing from a simulation, which is true and also the smallest of the problems. The distortion is technical as well, and on some tools it runs systematically in your favour.
A fill at a price you would never have got. A model that fills an order at the last price regardless of volume ignores the spread and the queue in the order book. On illiquid shares and options an order can fill at a price that was never in the book at all.
No partial fills and no slippage. The simulator takes the whole size in one go. In the market a larger order works through the book in pieces and the average price drifts. XTB says outright that transaction size does not affect a demo fill, and TradingView’s documentation says nothing about slippage, partial fills or the impact of your own volume.
Delayed prices. At least 15 minutes on most educational games, with Planspiel Börse the exception, on share and ETF CFDs at XTB, and on most share and futures exchanges on TradingView without a paid data package. A long-term strategy does not care. An intraday trade enters a full quarter of an hour of movement late.
Missing corporate actions. XTB pays no dividends, rights issues or other corporate actions on a demo. A dividend strategy cannot be checked there.
Hindsight you did not have at the time. Testing over history makes it easy to use information that was not available then, because switching timeframe or nudging the slider is enough. And a list of today’s index members leaves out the companies that have dropped out along the way, so a test run on it looks better than it would have done live. Both are general properties of testing on the past and not faults of any one tool.
Tax and currency conversion. None of the tools mentioned accounts for either. The Stock Market Game says explicitly that it does not teach tax consequences. On foreign shares, conversion and dividend withholding cut the return in real life.
Where the simulator ends and a broker demo begins
A simulator is good for the mechanics of a product: how leverage and margin work, what happens to a futures position at expiry, how a position is split, how a stop-loss behaves. The principles look similar across platforms, even though each one sets them up its own way. Execution, spreads and the behaviour of one particular platform only come through on that broker’s demo.
Virtual capital, account currency and the delay on share data vary from one demo to the next. From a simulation point of view only one thing matters. A demo runs inside the broker’s live platform, so you get to know the exact environment you will be trading in. On share and ETF CFDs, expect the 15 minute delay.
Costs cannot be checked reliably on a demo with any tool. eToro writes that trades in a virtual account carry no fees, and the Trading 212 help pages say nothing about spreads or overnight interest. Go through spreads, swaps and commissions in the broker’s fee schedule, because a simulation will not confirm them.
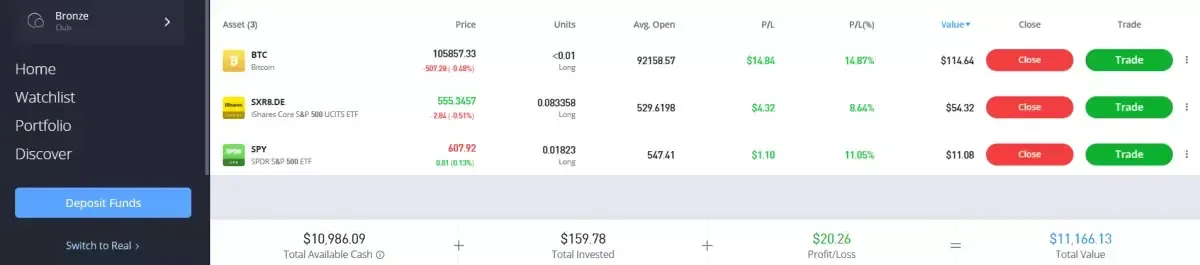
Try the mechanics of a product in paper trading, practise the decisions in a bar replay, work a long-term portfolio out in a spreadsheet, and leave a specific broker’s platform for that broker’s demo. Move to real money once you have written rules down and a run of trades where you kept to them. The height of the virtual balance says nothing about that readiness.
And take it that a result from a simulator says nothing about a result on a live account. Simulation flatters the fill, ignores tax and does not know the weight of your own money. What it leaves you with is hours of practice and mistakes that cost nothing.